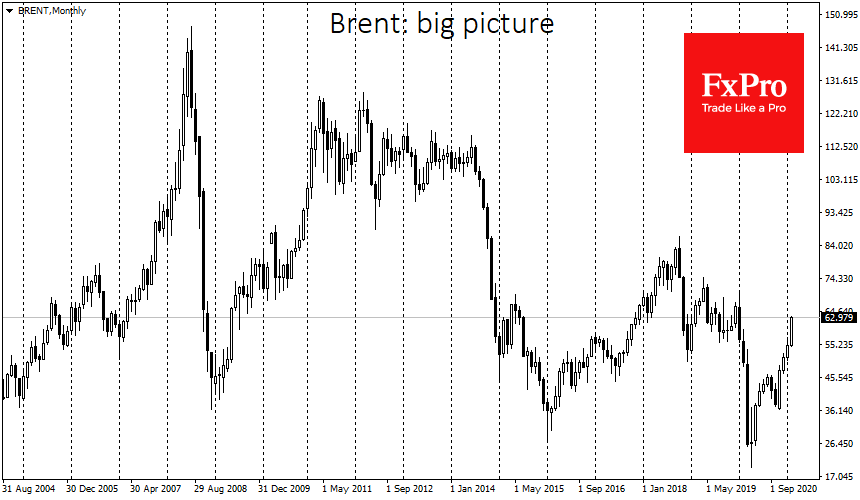
Brent prices surpassed the $63 mark in early trading on Monday, bringing this month’s growth to 15%. Middle East geopolitical tensions drove the latest impulse.
The Saudi-led coalition in Yemen said it had intercepted a drone of the Iranian-backed Husit group. Differences between Iran and Saudi Arabia have faded in recent months due to a coordinated effort to maintain oil prices.

Brent’s impulsive reaction has been attributed to fears of supply disruption. But what if there should be fears of a renewed struggle for market share? In that case, there would be fewer and fewer supporters of hard quotas in OPEC+.
In August 2019, an attack on Saudi Aramco’s refining capacity caused a 12% jump in prices. However, less than three weeks later, they sank even lower as the falling output was compensated from inventories, and the confrontation did not intensify.
Something similar might happen this time as well. A side effect of rising prices is re-established frictions between the frenemies in the cartel.
The same risks are represented by Russia’s increasing pressure, which has already started to promote the idea of normalizing production volumes when Brent is approaching $50. Since August, US shale producers have long since shifted from expectation to action, increasing the number of oil rigs last week by 78%.

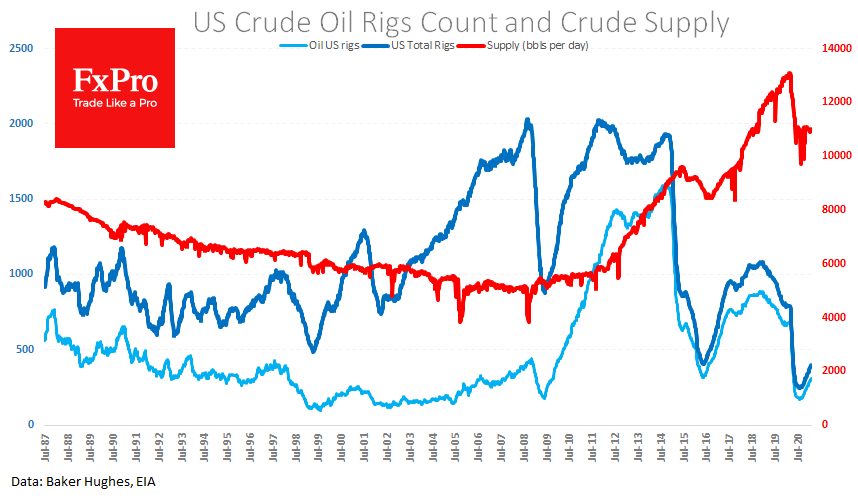
Brent is currently worth about as much as it was at the end of January 2020, when reports of coronavirus in China began to have a visible effect on the market. The price level has thus already fully recovered. Simultaneously, production volumes are about 10% lower than a year ago, as there is usually 4-9 months between drilling and supply.
Oil has risen too high too fast and could considerably slow down further global recovery. Therefore, it is in the interest of the big oil demanding countries (including the US) not to force a transition to new energy, but to be on the “cheap fuel” side.
The strong oil price impulse is also confirmed by the extremely high RSI, which now rises to 80 on daily charts. The last time the RSI was so high was in February 2012 when Brent reached $125 but then gradually lost its growing momentum and, after a month of hovering, turned back to decline and not did reach those values again.
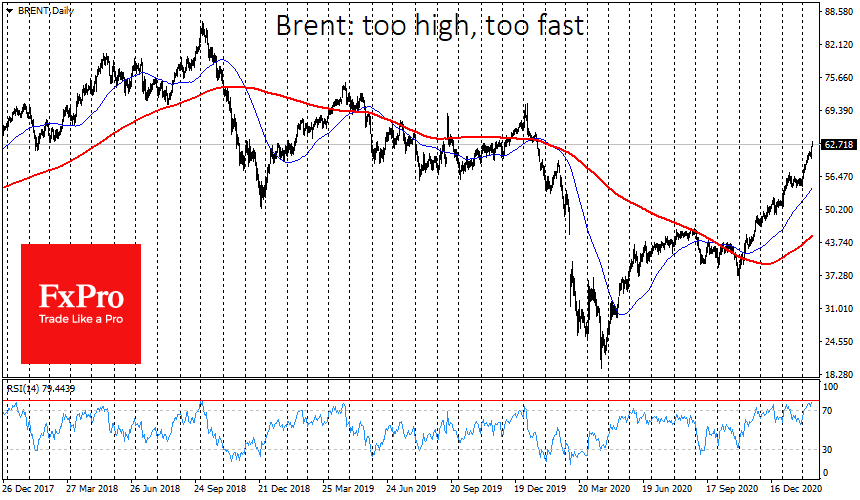
It is unlikely that the outcome will be as dramatic this time. However, a correction from the $63-$65 area is imminent and could be quite deep and painful for short-term traders.
The FxPro Analyst Team