Oil and gas took a massive hit during the New York trading session. Oil and gas fell sharply for different reasons, but in both cases, we could witness a bearish energy reversal after more than fivefold price gains from the macrocycle lows of April 2020.

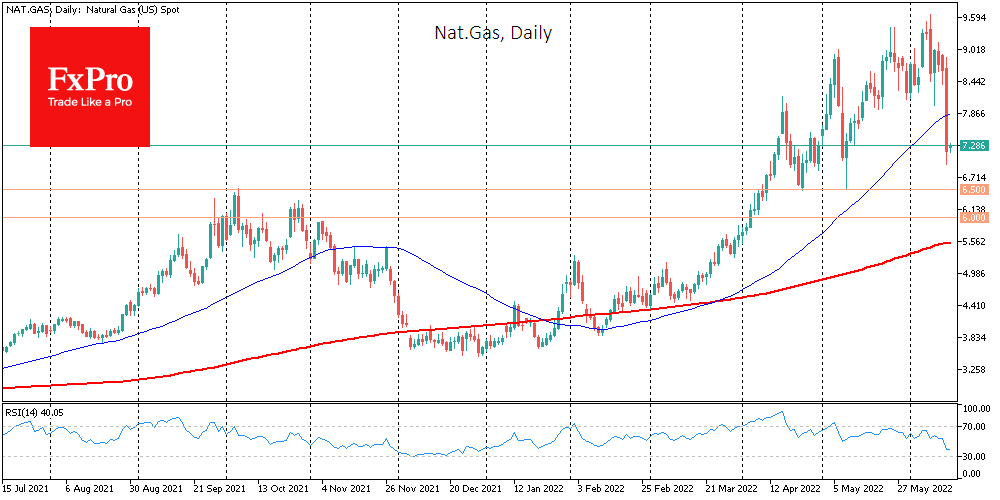
Natural gas was momentarily losing over 20% on Tuesday on reports that Freeport LNG is set to get its terminal back online within 90 days. It is speculated that a full recovery is not expected until the end of the year, but gas futures have managed to cut losses from 20% to 18%, trading at $7.26 at the time of writing.
It’s counter-intuitive, but the gas price peaked on the day the Freeport LNG fire was announced on June 8, and from a peak at $9.6, the price has fallen by a quarter. If we do see a reversal, it would not be surprising if gas loses ground rapidly down to 6.5 or even 6.0 before the bears make their first attempts to lock in profits.
Oil is also turning around. Brent is in its fifth trading session showing a downtrend with a sequence of increasingly lower lows and highs. Yesterday morning, we saw bulls’ efforts to break the trend run into furious selling as the price lost 5% or almost $6 in less than five hours.
In early March, we had already seen that oil was looking too expensive for buyers in the market and economy, causing a demand shock and triggering a correction. Fresh data from the IEA highlights that global inventory rose in April for the first time in almost two years. However, OPEC+ is increasingly falling short of quotas, and US production has stagnated near 11.9m BPD for the last ten weeks.
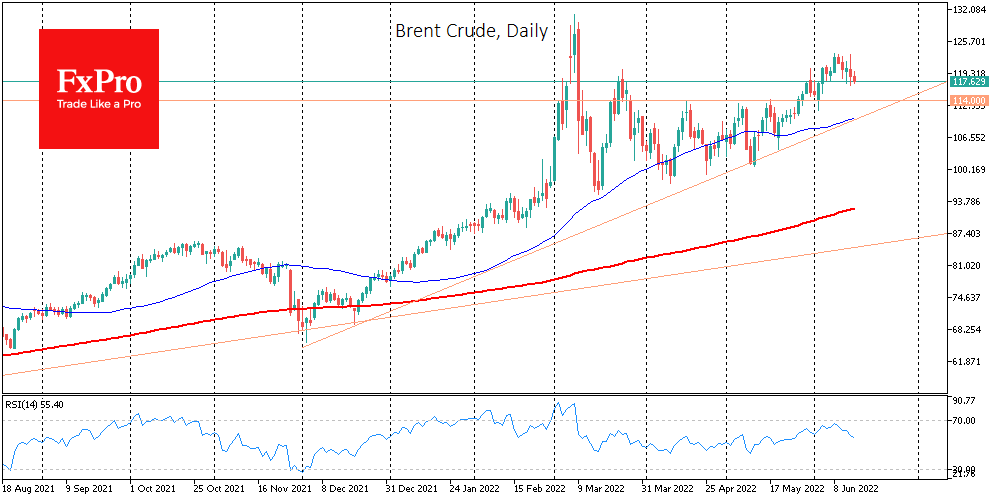
Our estimate is that we will see the end of a multi-month rally in oil strengthen if Brent consolidates below $114. That would be a drop from the beginning of the month and a dip below the locally significant level, which was resistance in April and May and support in early June.
An even more reliable signal for the bears’ victory would be a consolidation below $110, where the 50-day moving average now passes. That could open a direct and unexpectedly fast road to the area of $100 by the end of August. However, we expect it to stay in the $100-120 range for the rest of the year.
The FxPro Analyst Team