Oil prices are going up because the largest members of the OPEC+ cartel are facing a shortage. The US has increased its production since August without increasing the number of drilling rigs, only boosting output from existing ones. These conditions offer a positive outlook for the market, although there are signs of local overheating of prices.

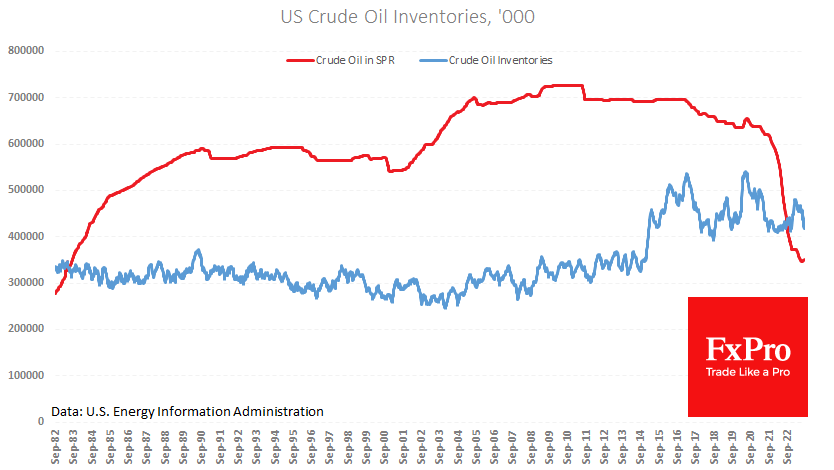
Last week, commercial crude oil inventories increased by 5.56 million barrels, 2.1% below the level from a year ago. WTI crude oil prices are roughly the same as a year ago, and their increase in August was the main contributor to inflation rise.
Formally, the current situation is similar to last year. However, having mostly the same input conditions this time last year, the US presidential administration was selling SPR with the fastest speed. The strategic reserve has been restocked in the past week with 0.29 million barrels. Officials have not mentioned further selling of assets because they are currently at their lowest point in 40 years.

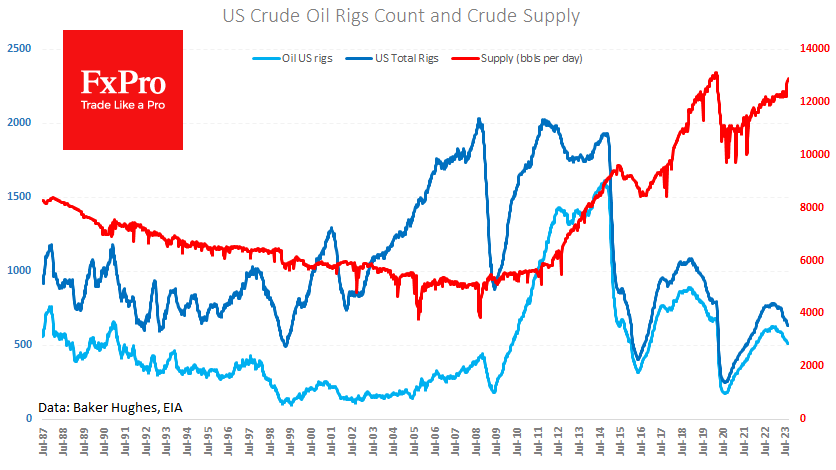
Last week, the daily average production rose to 12.9 million barrels, up from the previous three weeks’ average of 12.8 million. In the first seven months of this year, production was consistently at 12.2 million barrels. Surprisingly, since the beginning of the year, US companies have decreased their drilling activities. The most recent data shows that the number of oil drillers was only 513, an 18% decrease from the peak of 627 in December last year.
What a change from the scenario we saw after 2009, with almost 10-fold growth within the following five years. From our point of view, drilling activity correlates with interest rates. Also, the Fed guarantees that this factor will continue to be in effect for a long time, which unintentionally leads to favourable situations for oil by reducing supply.

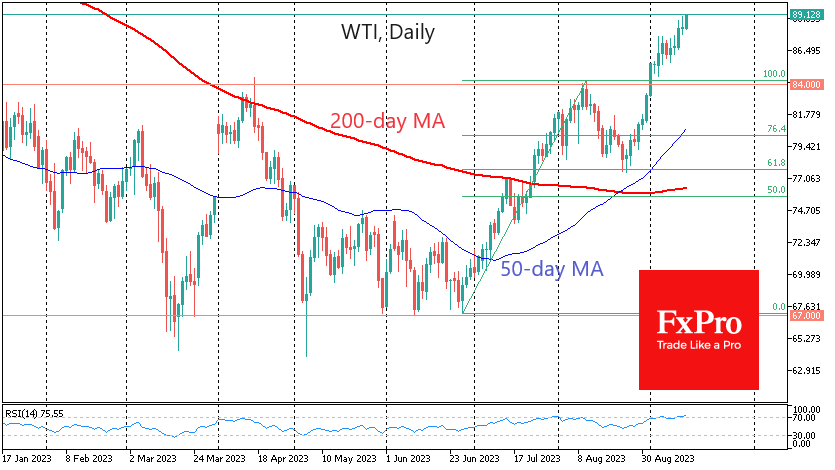
The technical chart backs up the bullish view on oil. The dip in the latter part of August allowed for another push, which is where we are currently. Long-term moving averages (MA) favour the bullish outlook. The potential target is $95 per barrel WTI, with a 161.8% Fibonacci retracement from June’s end to August’s peak.
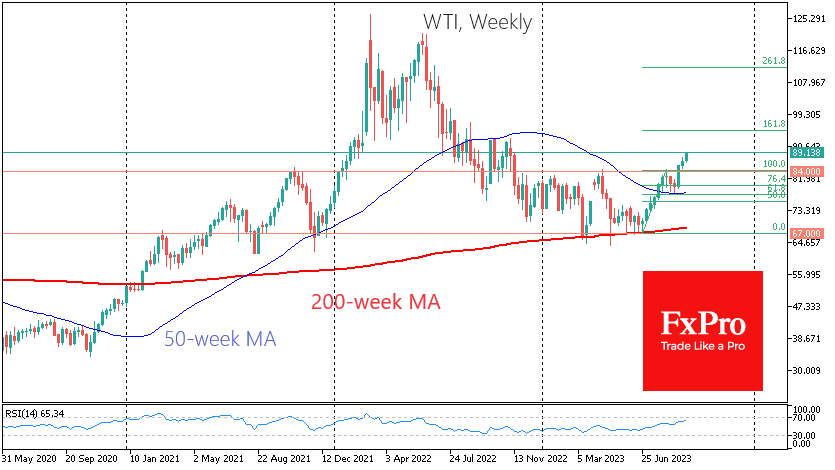
The weekly timeframes show solid backing in nearing the 200-week MA. Recently, the 50-week MA initiated a fresh buying wave after a correction occurred at the end of last month.
Daily timeframes encountered the “golden cross” pattern during this period, which previously took place in oil in September 2020 and spurred a threefold price increase in the next one and a half years. It’s unlikely for this level of intensity to reoccur, but the power and significance of the signal shouldn’t be underestimated.
The FxPro Analyst Team