Bitcoin price has remained above $10,000 for some time, but will the momentum tip back in the bulls favor for a retest of the key multi-year resistance at $12K? The recent week has been relatively dull on the price movements of Bitcoin (BTC), as a slow upward trend was established after Bitcoin’s price found a footing at above $10,000. This rally then continued toward $11,000 on Sep. 18 but was pushed back by some short-term resistance levels.

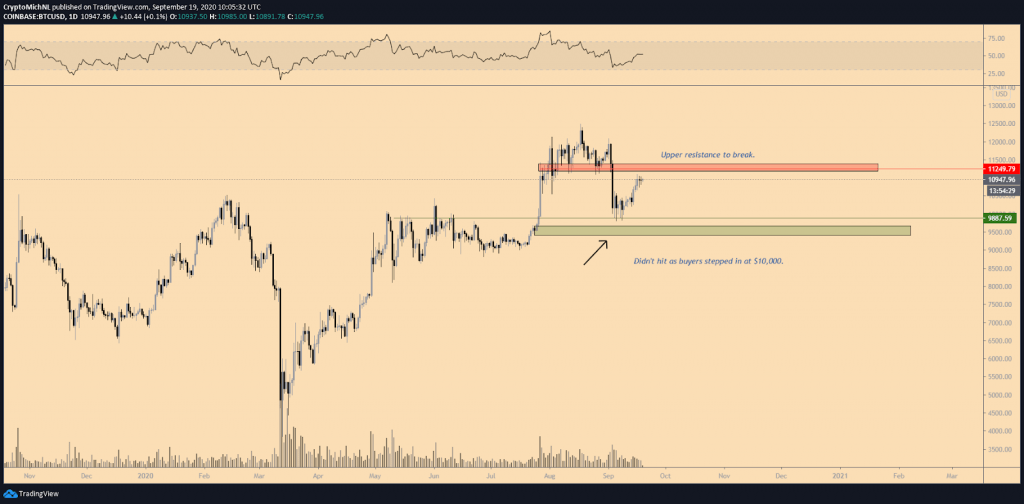
The previous week has been focused solely around Uniswap (UNI) and the airdrop of its token, combined with several listings on high-end exchanges. At the same time, let’s take a look at the price of Bitcoin and its charts to gauge where the cryptocurrency market may be headed in the upcoming week. The daily chart of Bitcoin shows the slow upwards grind, which is currently facing a crucial resistance.
The $11,200-11,400 area has been acting as support for a substantial period before the big crash to $10,000 occurred. If this area between $11,200-11,400 can be broken, a retest of higher levels is back on the table. However, the level to test around $9,600 (which is also the CME gap) wasn’t fully filled. The level got front-run by traders, and the price of Bitcoin bounced back above the $10,000 level.
A range can now be constructed with these two regions. On the downside, the $10,000 area is a significant support zone with the potential of $9,600 being hit. On the upside, the $11,200-11,400 area is a crucial resistance area to break. The 2-hour chart shows a clear picture of the current uptrend. Every previous resistance level flips for support to continue this climb higher.
The crucial hurdle to take is shown in the big red box is found between $11,200-11,400. If that resistance level breaks through, retests of $12,000 are back in play. However, if the price of Bitcoin loses the $10,750 area, further downside becomes increasingly likely with the range lows around $10,000 as potential support levels.
Will the CME Bitcoin futures gap buyers at $9,600 be left in tears?, Cointelegraph, Sep 19