Categories: Market Overview

Will oil continue its rise this time?

Oil went on the offensive last week, once again confirming the importance of support at the 200-week moving average. Both robust US economic data and OPEC+ intentions to keep production under control fuelled the rally. All this is on top of growing supply issues across the Red Sea.
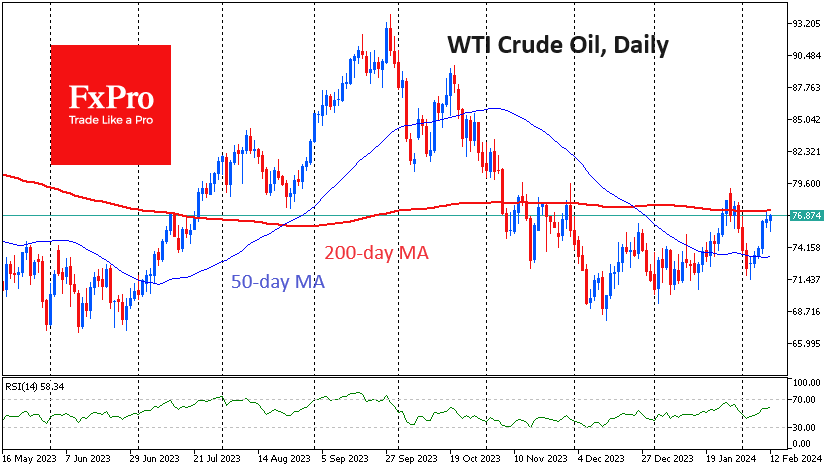
Oil is currently undergoing a crucial technical test in the form of the 50-week and almost synchronised 200-day moving averages. This area has acted as significant resistance over the past three months.

A break above the 200-day would mark a significant shift in trader and investor sentiment, potentially paving the way for more active buying. Failure to do so could be followed by a relatively smooth fall to $72 for WTI and $75 for Brent.

The FxPro Analyst Team

The FxPro Analyst Team

Our team consists of financial market experts. Our dedicated professionals prepare reviews on the foreign exchange market situation, Crude Oil, Gold and Stock Indices. All the analysts are regularly published in the world leading economic media.

Share
Published by
The FxPro Analyst Team

Recent Posts

WTI crude oil Wave Analysis 3 January 2025

- WTI crude oil broke resistance area - Likely to rise to resistance level 76.00…

2 days ago

S&P 500 index Wave Analysis 3 January 2025

- S&P 500 reversed from support area - Likely to rise to resistance level 6000.00…

2 days ago

Gold growth halted but with upside risks

The technical picture for gold is mixed, but a dip below the 50-day moving average…

2 days ago

Stocks start the year in fear

The US stock market is starting the year in a state of fear, as reflected…

2 days ago

The crypto hesitates to grow without stocks

The crypto market is struggling to grow without the support of stock markets, with reduced…

2 days ago

NZDUSD Wave Analysis 31 December 2024

- NZDUSD broke key support 0.5600 - Likely to fall to support level 0.5500 NZDUSD…

5 days ago

This website uses cookies