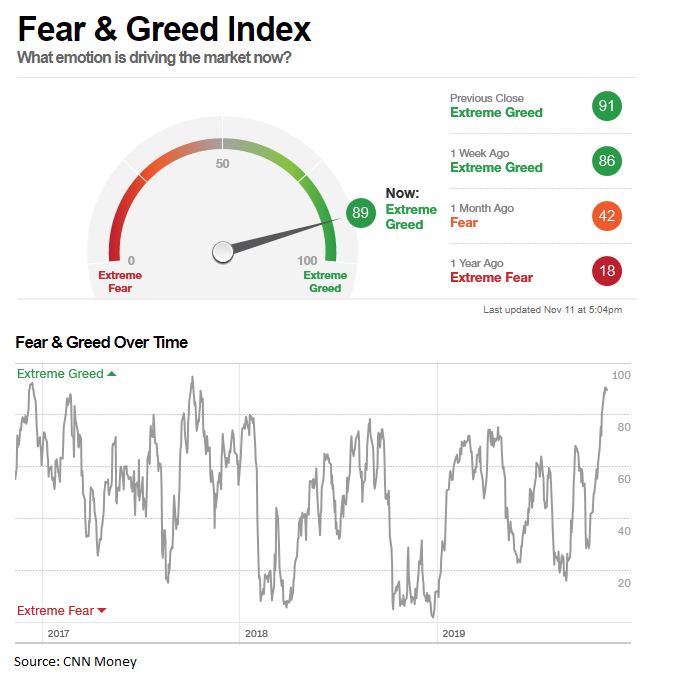
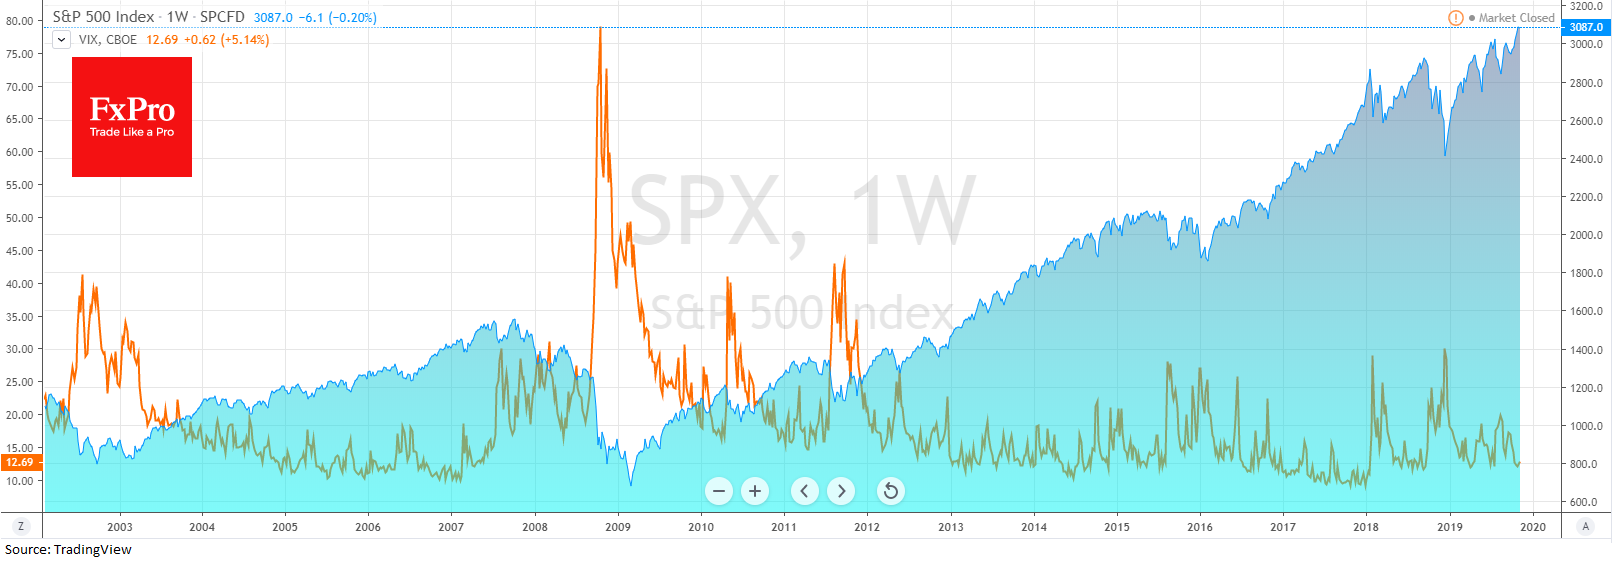
Global markets traded almost unchanged on Tuesday morning. US indices have managed to pull through the corrective moods, and futures for the S&P500 index have returned to historical highs. Asian indices traded almost flat. The volatility of the US stock markets has been declining for the last couple of weeks. This calm seen in the return of the VIX index to this year lows near 12 level. The Greed and Fear Index for US stock markets now stands at 89, level of “extreme greed”, contrasting brightly with the level of 18 just one year ago.
Both indicators show a confident purchase of stocks by investors. However, by a greater extent, this is characteristics of the past, not future. Often in such conditions, investors should ask themselves a question like, what if many have already bought, who will be the next buyer? This makes us very cautious about the nearest prospects of the markets.
Four market corrections followed the decline of VIX to levels below 12 in just over 12 months. Strictly speaking, it is not so much the shallow VIX levels that are important, as the growth of this indicator from these lows. Restoring of market volatility launches the chain of profit-taking and bubbles deflation.
The longer the markets were in a state of serene calm, the more significant can be the correction with a real explosion of volatility. Since the beginning of the year, we have seen three relatively short attempts to defuse excessive tension: in May, July, and September. The September’s 5% correction was the smallest, that may be an indirect sign that the markets did not release all the steam out.
As in the case of the Earth’s interior, the tension may increase, coming to the surface periodically. We have very few observations, and the model itself is too multifaceted to build accurate predictive models. We can only say with certainty that the longer the internal stress stays on the markets and the longer the optimism reigns, the more devastating the subsequent impact may be.
As the FxPro Analyst Team said, for markets, this means that the current rally has reached a precarious cornerstone in recent weeks and months. Declining volatility and extreme levels of “greed” are also evidence of the final stage of the rally. The duration of this growth is now mostly dependent on the creativity of central bank policies. The central banks still have the opportunity to extend the rally of the markets for months ahead. However, they are risking to get an even less manageable drop in the future, capable of “correcting” all the growth of the last decade.
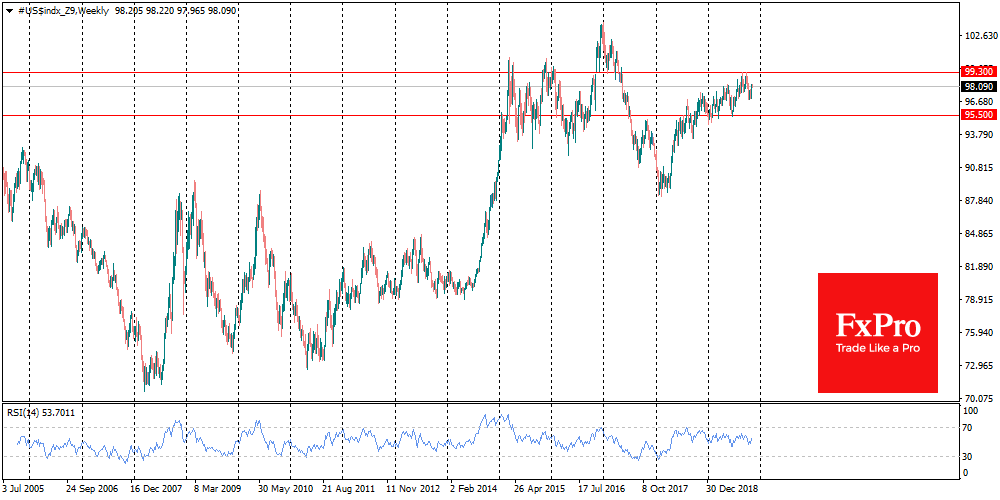
Potentially, a correction to market growth over the past ten years could send the S&P 500 index to the 2200 area, which is 30% below current levels. The dollar may have a similar amplitude, which can jump by 25% to the basket of major currencies, and the euro/yen pair risks to collapse by 30% against the background of global deleveraging. However, one cannot exclude the smaller, 5%-10% declines in the coming weeks. In this case, it will be possible to say that the internal tension of the markets may increase further. It is impossible to predict when and in what direction the future spike of anxiety in the financial volcano will take place. So far we can only see signs of its imminent eruption.
The FxPro Analyst Team