Categories: Market Overview

Weekly Bitcoin Price Indicator Shows ‘Bear Cross’ in First Since February

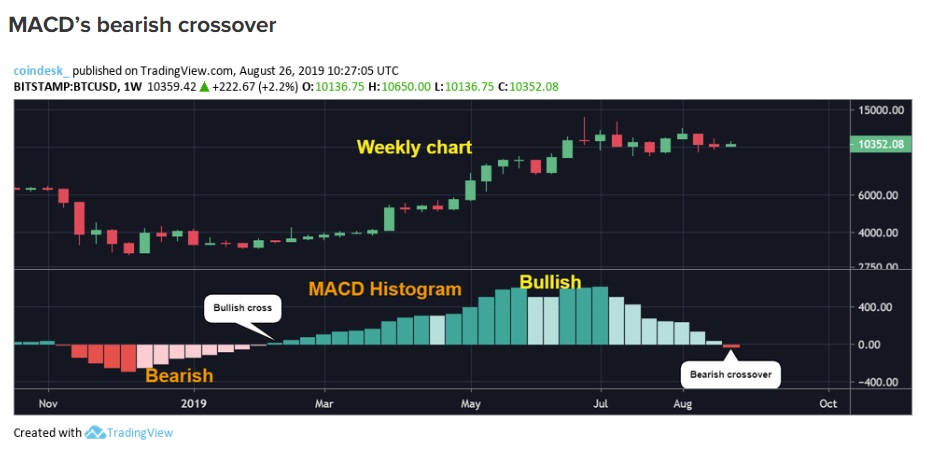
A widely-tracked trend-following bitcoin (BTC) price indicator is flashing a sell signal for the first time since February. The weekly moving average convergence divergence (MACD) histogram, which is used to identify trend reversals and trend strength, has crossed below zero and is currently printing a value of -25.13.

That is the first negative value since the first week of February. Back then, BTC was trading at $3,700. As of now, the leading cryptocurrency by market value is changing hands at $10,340 on Bitstamp, representing 2 percent gains on a 24-hour basis. The histogram crossing below zero is considered a sign of the beginning of a new downtrend, while a move above zero is taken as confirmation of a bearish-to-bullish trend change.

Histogram’s latest drop below the zero lines indicates the rally from lows near $3,700 seen in the first week of February topped out at $13,880 in June and the bears have regained control. Many observers consider MACD histogram as a lagging indicator. After all, it is a spread between two moving averages (MAs), which are based on past data. Also, MACD’s bearish crossovers marked an end of corrective pullbacks during the 2015-2017 bull market, as tweeted earlier today by popular analyst Murad Mahmudov.

Weekly Bitcoin Price Indicator Shows ‘Bear Cross’ in First Since February, CoinDesk, Aug 26
The FxPro News Team

This team of professional journalists announces the most interesting and influential articles from the major financial media as a brief summary. All such news may have sufficient potential to affect the course of trading assets.

Share
Published by
The FxPro News Team
Tags: Bitcoin

Recent Posts

Forex has set its priorities

In 2026, experts favour the yen, see modest euro growth, and expect pressure on the…

3 hours ago

Bear market rebound in crypto is likely to continue

Crypto rebounds continue; Bitcoin faces resistance, with a mixed market outlook ahead, as regulatory changes…

4 hours ago

Coca-Cola Wave Analysis – 4 December 2025

Coca-Cola: ⬇️ Sell - Coca-Cola reversed from long-term resistance level 73.25 - Likely to fall to…

17 hours ago

DraftKings Wave Analysis – 4 December 2025

DraftKings: ⬆️ Buy - DraftKings reversed from support zone - Likely to rise to resistance level…

17 hours ago

NVDA Wave Analysis – 4 December 2025

NVDA: ⬆️ Buy - NVDA reversed from support zone - Likely to rise to resistance level…

19 hours ago

Basic Attention Token Wave Analysis – 4 December 2025

Basic Attention Token: ⬇️ Sell - Basic Attention Token reversed from resistance level 0.2800 - Likely…

19 hours ago

This website uses cookies