Gold has lost 0.9% since the start of Monday, almost back to the point where it was trading before the release of jobs data on Friday. Perhaps the very first market reaction to the data release highlighted the mindset of key market participants: they are ready to sell.

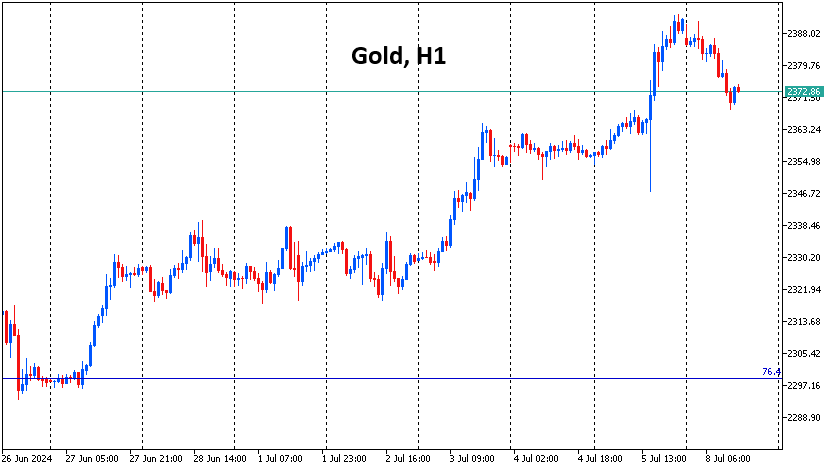
Gold has been on an upward trend since the last few days of June, leading the price up 4% to $2390 at its peak on Friday. This can largely be attributed to the dollar’s 1% decline, as gold often moves with a higher amplitude.
Weak employment figures also pushed up the gold price on Friday, leading to a weaker dollar and bringing the start of rate cuts closer. However, we note the momentum of the 0.8% decline in gold in the first moments after publication.
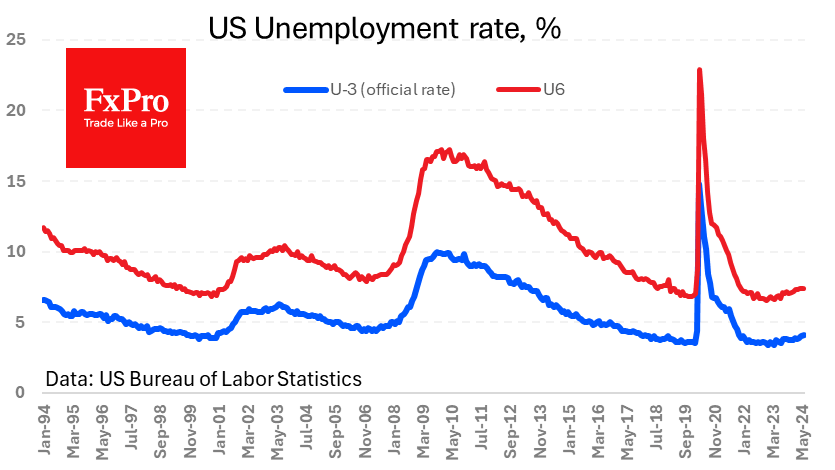
The subsequent market reaction was a “worse is better” style: the weakness in the labour market increased expectations of a rate cut soon, which boosted risk appetite. But this is a very unsustainable play, as not all the negativity in the macro economy is disinflationary. Just the opposite, we saw confirmation of wage growth (4.1% y/y) above inflation (3.3% y/y). At the same time, the previous months’ hiring figures were revised downward, and the unemployment rate reached a 31-month high.
Thus, the economic situation is deteriorating faster than inflation is slowing. A key rate cut, in this case, would be an attempt to support economic growth rather than remove excessive tightness in monetary policy. That is, the chances of a cut for “bad” reasons rather than good ones are growing, which is negative for risk appetite in the medium term.
On the charts, gold has so far hit resistance at $2390, which also caused a local reversal in April. Further improvement in risk appetite in global financial markets cannot be ruled out and may be helped by the reporting season. Gold’s ability to gain strength above $2390 could serve as an important price signal, heralding a fresh assault on historical highs near $2450.
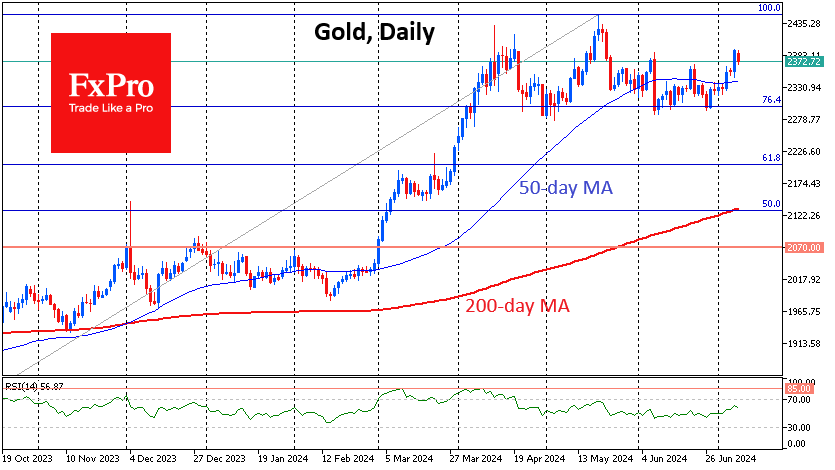
However, we see more chance of further pressure on the gold price. We see the 50-day moving average at $2340 as the first signalling point. If this line is stormed without bullish resistance, the price could quickly retreat to the $2300 area, which is crucial for determining the dynamics for the coming months. A fall below it would be seen as a break of the bullish trend since October when the Fed first signalled its willingness to cut rates.
The FxPro Analyst Team