Recent data on weekly applications for unemployment benefits in the US came out mixed. There were 1.48M of the initial claims last week. Once again, it is showing a decrease in noticeably slighter than median expectations (1.32 million). A week earlier, this figure was 1.54 million.

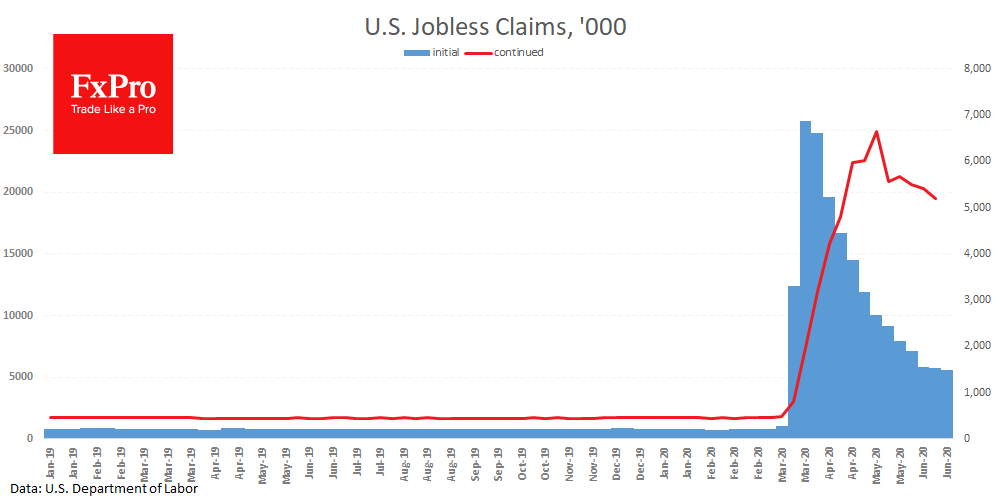
The number of continued claims, however, presented a positive surprise, dropping to 19.522M against the expected 19.97M and 20.29M a week earlier.
Both of these indicators peaked in March and May, respectively. However, it is still difficult to see the V-shaped economic recovery on these charts. This divergence widens the gap between the behaviour of US stock indexes and employment statistics. The latter very often acts as a reliable leading indicator of economic activity, capable of returning markets from heaven to earth.
The FxPro Analyst Team