Market activity has declined markedly and changed little with China leaving for the Lunar New Year celebrations. But we should not be discouraged by the US and European indices’ performance, where the growth impulse seems exhausted. At the very least, it’s a signal that markets are about to stall near their current levels. However, it’s often a harbinger of a notable correction. Much more profound than we saw last month.

As the key US indices rose to new all-time highs, trading volumes fell steadily. Volumes had increased in the previous two days, but only thanks to intraday corrections. This dynamic only confirms the observation that many wish to take short-term profits at the first sign of a trend reversal.
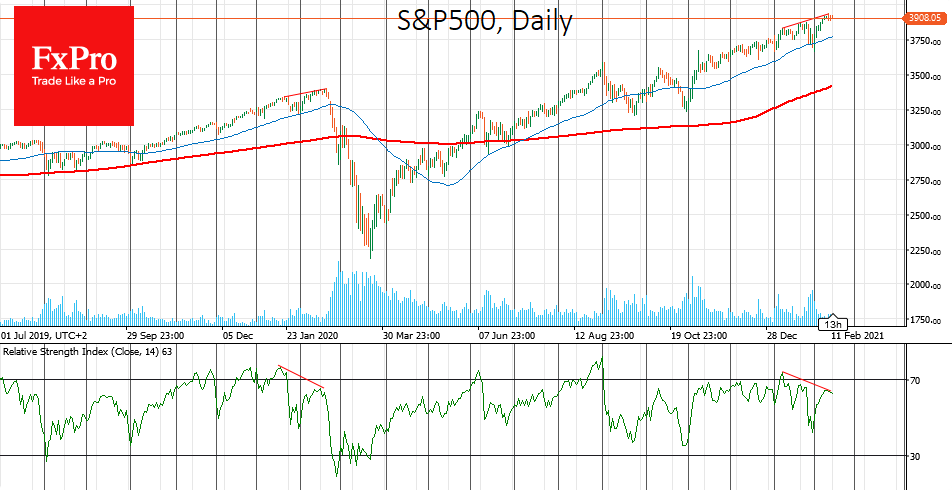
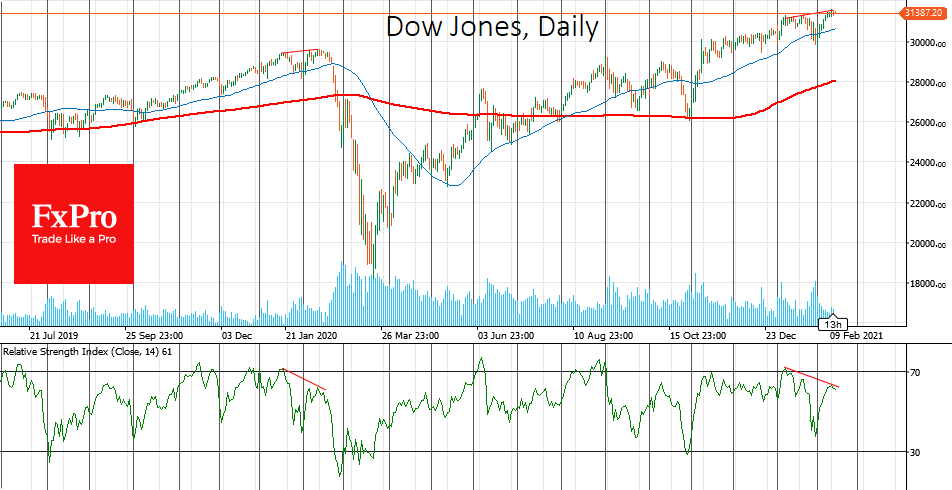
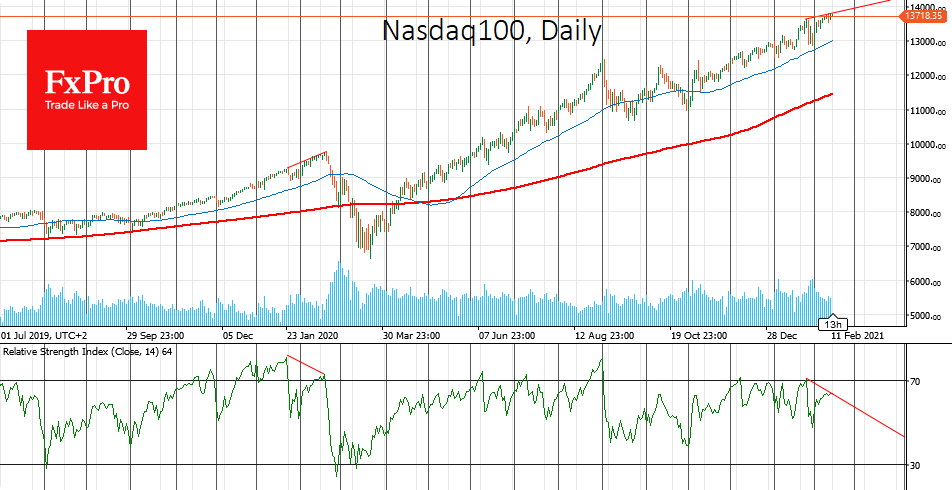
Another divergence can be seen between US stock indices daily charts and the Relative Strength Index. Higher highs for prices correspond to lower highs for RSI, further reflecting the exhaustion of growth momentum.
We saw the same thing a year ago: before the slippage at the end of January, the price was going up, but volumes were falling. The epic fall started at the end of February. It would be too pessimistic to say that the same deep downturn is coming, but a good correction is clearly in sight.
If we are accurate, and correctional sentiment increases, the momentum near the 50-day moving average will increase traders’ attention. It is a crucial signal line for the short-term trend, as a drop below it often separates a small pullback from a deep correction. A strong break-down under the 50-DMA would almost immediately turn the 200-DMA into the next target for bears.
However, investors should keep in mind that despite very tangible chances for a short-term correction, the fundamentals (printing press and pandemic easing) are working for the market. So it would be too hasty to bet on a multi-year bear market.
For such an ultra-bearish scenario, not only does one have to wait for a fall below the 200-day average, which is 10-15% below current levels, but governments and central bankers have to remain blind-sighted during such market volatility.
The FxPro Analyst Team