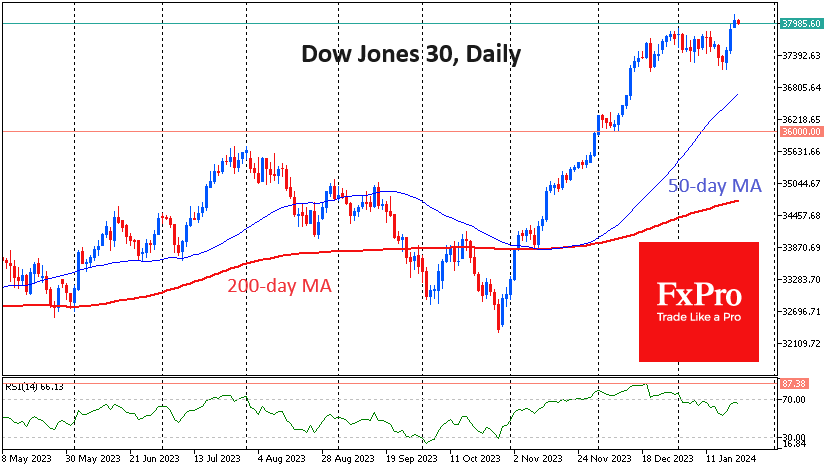
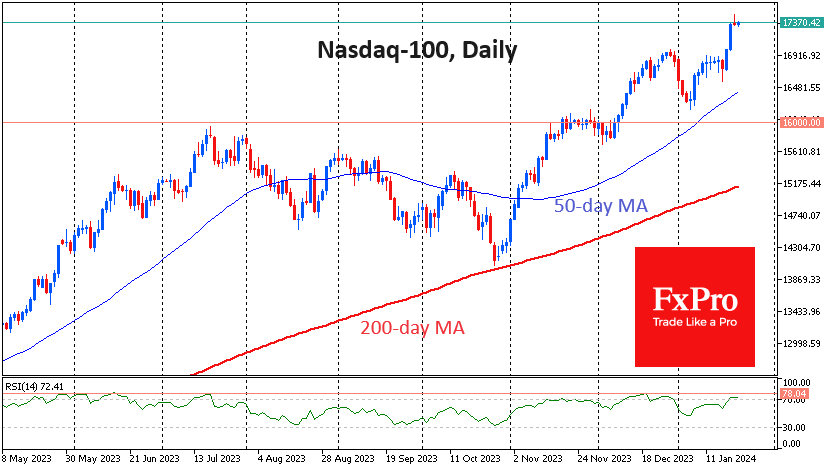
US indices rewrote all-time closing highs on Monday, with the Dow Jones taking the next round level of 38,000 among them, while a day earlier, the Nasdaq100 climbed above 17,000 in a powerful 2% gain for the day. Japan’s Nikkei225 reversed to the downside intraday when it was within a hair’s breadth of 37,000 – a new 34-year high.

With a brief halt in early January, a period of increased greed in equities has persisted since late October. Since the rally has lasted for quite some time, we are looking for and finding signs of potential exhaustion of the upside. And there are plenty of them.
First, the narrative – the reason for the rally, as explained by the media – has changed. Initially, stocks rallied on the change in rate expectations. It was a “the worse the data, the faster the Fed will cut rates” movement. The most dovish sentiment in rate expectations was recorded on 12 January, when the market was pricing in an 80% chance of a rate cut in late March. Ten days later, the market is giving a 44% chance of such a move. Now, robust data is a sign of the strength of final demand.
Second, here and there, waves of profit-taking are evident. S&P500 futures reached their highest point just after the market opened on Monday before pulling back 0.3%, going into a very narrow trading range, and the Nasdaq100 went into negative territory late in the day on Monday. Japan’s Nikkei lost over 2.5% from peak to bottom after setting a 34-year high.
Notably, Bitcoin and following it, the entire cryptocurrency market is playing out the change in interest rate expectations like a textbook, having recorded a price peak on 11 January and declining with minor stops all along.
Third, on daily timeframes, new highs in all three key US indices (Dow Jones, Nasdaq100, S&P500) are being recorded at the same time as lower highs in the Relative Strength Index. This is an important indication that the upside momentum is wearing off.
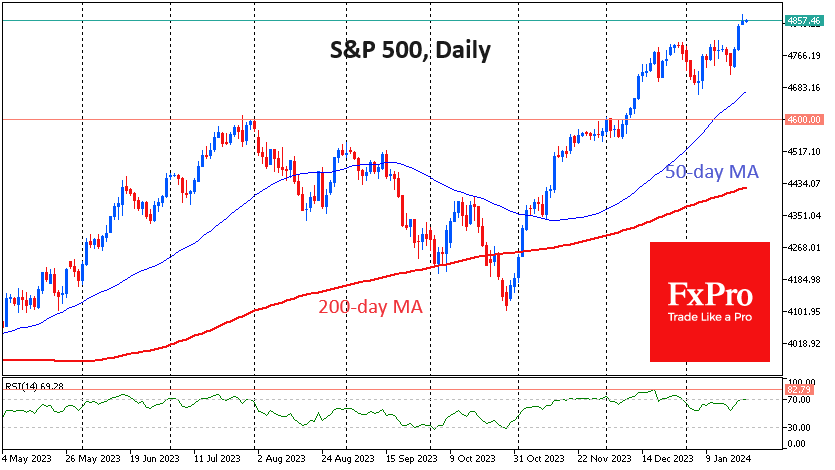
A decisive move down in the stock indices at the end of the day on Tuesday or Wednesday could trigger the start of a broader and decisive correction with the potential to take the Dow Jones back to 36,000, the S&P500 closer to 4,600, and the Nasdaq100 back to 16,000. And then we’ll have to see if this 5–7% correction can change the Fed’s tone, making the March decline once again expected.
The FxPro Analyst Team