US equity markets have been hit by a sell-off, with the Nasdaq100 down more than 3% and the S&P500 down more than 2%, the biggest drop in almost a month. Nvidia’s share price fell more than 10% as the antitrust investigation intensified.

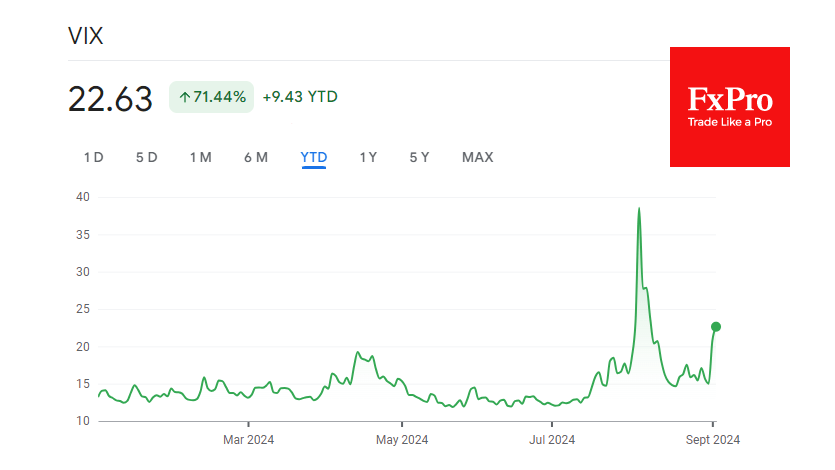
The VIX index spiked 45% to 22.6, as it did in early August. In our observations, consolidation of the “fear index” above 20 points is associated with correction periods. On the other hand, the volatility spike in early August was a brief shock, and markets quickly recovered from the technical correction.
For the second time in the last two months, the S&P500 index was hit by sellers immediately after rising above 5660, turning this level into a resistance line. After pulling back to 5520, the index is now testing its 50-day moving average. At the end of July, a pullback to this line marked a pause in the sell-off before macroeconomic data shifted to the sell side.
Similarly, the S&P500 may now find itself in a tight range as it awaits Friday’s US employment data for directional cues.
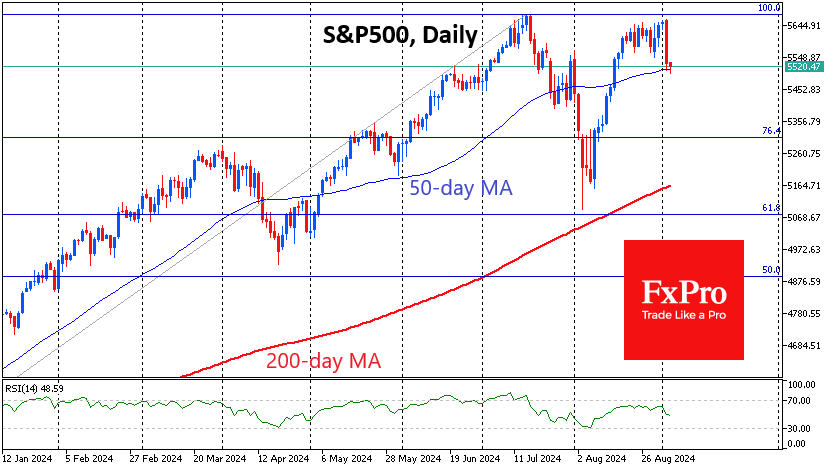
Technical targets for further declines in the S&P500 appear to be the 5150 area, where the 200-day moving average and support from the early August collapse are centred. A break below 5070 (61.8% of growth from October 2023 to July 2024) would be a global correction with the potential for a pullback to 4400.
Should the index return to all-time highs above 5660 in the coming days, it could be a prologue to another run to all-time highs as markets have already cleared much of the overbought conditions.
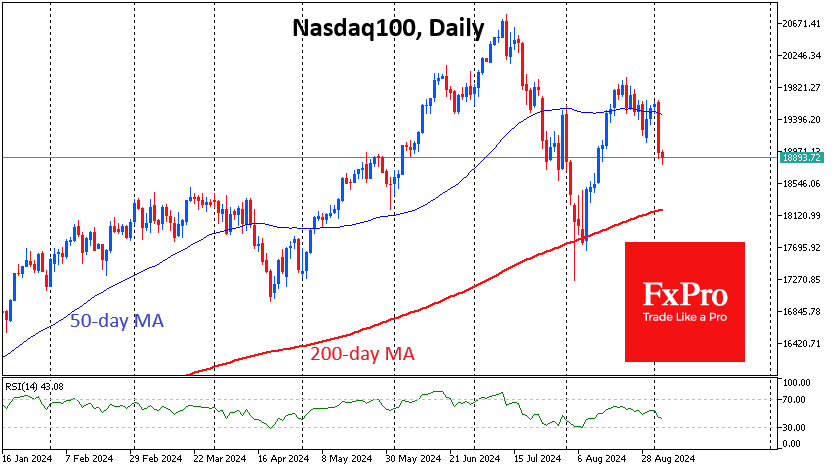
The Nasdaq100 is under even more pressure, having consolidated at 18900, well below its 50-day average (at 19500) and its third lower local high since the July highs. Technically, it now has an open road to 18200 (200-day average and local March-April resistance). A break below opens the way to 14500-15000.
However, as in August, a touch of the 200-day could well attract retail buyers. According to data going back to 1952, stocks account for a record 42% of Americans’ wealth. That’s largely due to the democratisation of access to stocks and funds and record-high stock prices. Historically low unemployment and impressive wage growth fuel new purchases, while correction sparks appetite.
The FxPro Analyst Team