The Dow Jones index added around 18% to its lows at the start of October and still performing better than the Nasdaq 100 and S&P 500.

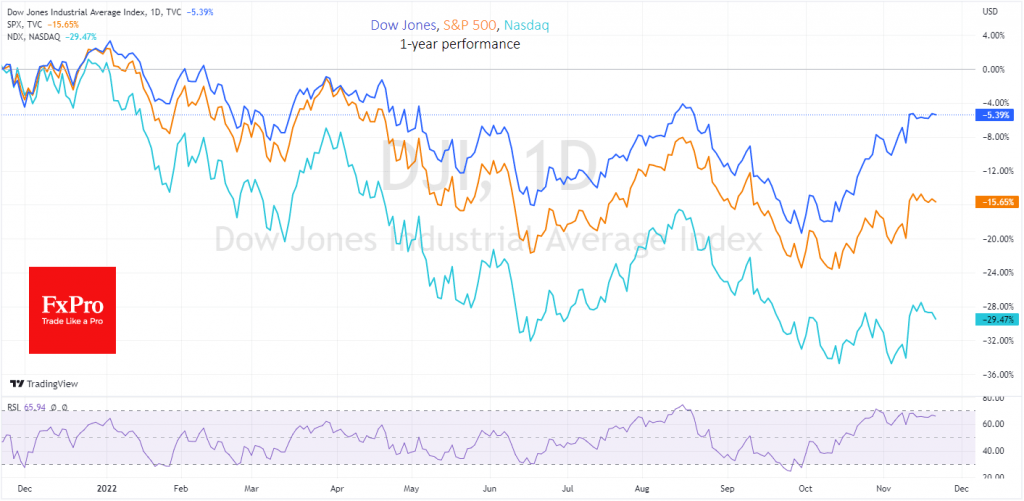
The index includes 30 large companies with sustainable businesses, which is very important at a time of rising interest rates and a slowing economy. To oversimplify, business viability and sustainability are not the top agenda for those companies, as it is for many companies in the S&P 500 and Nasdaq 100.
And a look at the DJI’s chart confirms its higher potential. The index has been striding resolutely briskly with minor shakeouts since early October. In the middle of last month, it consolidated above the 50-day average in a decisive move.
We saw an impressive battle for the 200-day average in late October and early November. In that battle, the bulls were victorious, making strong intraday moves upward through that curve. And on November 10, this curve was defined as support.
And all this at a time when the S&P500 has yet to face a similar battle with the long-term trend and has lost its upside momentum on the way up. And the markets can all fall equally fast, but the first to recover are those who lead in the cycle. This rule worked in 2009 and 2020.
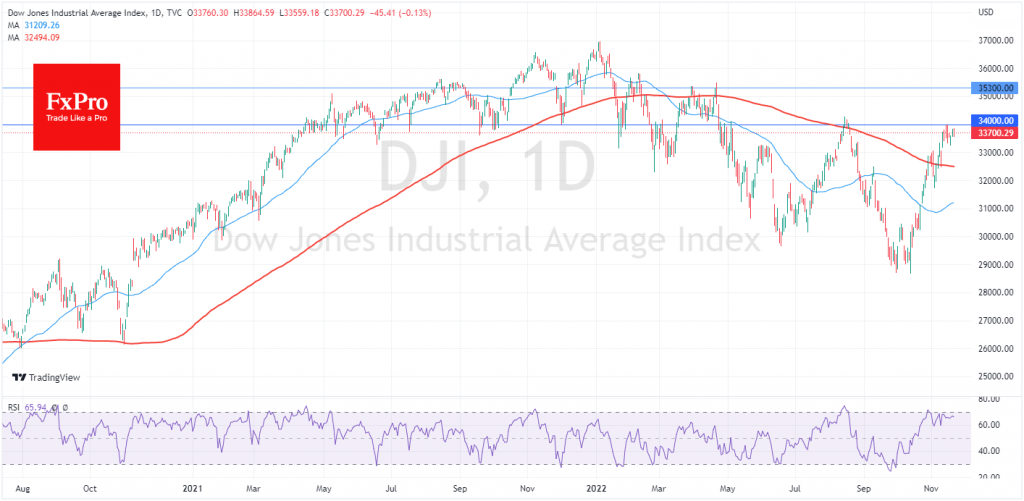
On the daily chart, the Dow Jones is hovering around the overbought area, but it is not rushing into it, marking a consolidation of buyer power. At current levels of 33,700, the index is near the site of previous peaks set near 34,000 in August.
If the short-term consolidation this week culminates in a breakout of resistance near 34,000, that would be the final signal that the global downtrend will be broken. If the current coalition turns into a new sell-off, a break-up of the 200 SMA would be a false signal. However, in the meantime, an upside movement after a pause is a reasonable working assumption. A consolidation above 34,000 might launch a new buying round that would take the index to the next level area at 35,300 before the year’s end and allow it to close a year in green.
The FxPro Analyst Team