Categories: Market Overview

This chart shows you the perfect moment to buy Bitcoin

It’s easy to get scared away by the daily volatile movements of bitcoin. Over the weekend, bitcoin jumped 20 percent in a matter of days. Since then, BTC shed over $1,000 before recovering slightly again. It’s a volatile market. But zoom out for a moment and you’ll see the bigger picture. This chart, shared by on-chain analyst Willy Woo, pinpoints the best windows of opportunity to buy bitcoin for the long term.

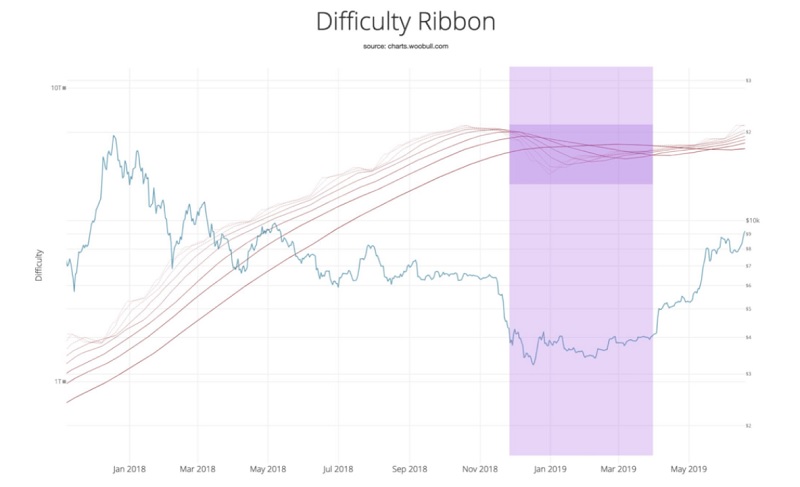
Using what’s called the ‘ribbon difficulty’ indicator laid across the long-term logarithmic bitcoin chart, it has historically predicted the best moments to get exposure to bitcoin over the last ten years. So next time you’re about to FOMO into the market, zoom out and take note of this chart.

According to Willy Woo’s analysis, the perfect moment to accumulate bitcoin is when the difficulty ribbon compresses (gets very thin) or flips negative (when the strong, dark line crosses above the weaker lines), shown below. The indicator accurately predicted the bottom of the market in late 2018, early 2019. Smart investors should have started accumulating at this point (many hedge funds were). It’s a data-driven confirmation of a decades-old investment strategy: buy when there’s blood in the streets. In other words, you buy assets when others are fearful, and sell when they’re greedy.

This chart shows you the perfect moment to buy Bitcoin, CCN, Aug 07
The FxPro News Team

This team of professional journalists announces the most interesting and influential articles from the major financial media as a brief summary. All such news may have sufficient potential to affect the course of trading assets.

Share
Published by
The FxPro News Team

Recent Posts

Forex has set its priorities

In 2026, experts favour the yen, see modest euro growth, and expect pressure on the…

2 hours ago

Bear market rebound in crypto is likely to continue

Crypto rebounds continue; Bitcoin faces resistance, with a mixed market outlook ahead, as regulatory changes…

3 hours ago

Coca-Cola Wave Analysis – 4 December 2025

Coca-Cola: ⬇️ Sell - Coca-Cola reversed from long-term resistance level 73.25 - Likely to fall to…

17 hours ago

DraftKings Wave Analysis – 4 December 2025

DraftKings: ⬆️ Buy - DraftKings reversed from support zone - Likely to rise to resistance level…

17 hours ago

NVDA Wave Analysis – 4 December 2025

NVDA: ⬆️ Buy - NVDA reversed from support zone - Likely to rise to resistance level…

18 hours ago

Basic Attention Token Wave Analysis – 4 December 2025

Basic Attention Token: ⬇️ Sell - Basic Attention Token reversed from resistance level 0.2800 - Likely…

18 hours ago

This website uses cookies