
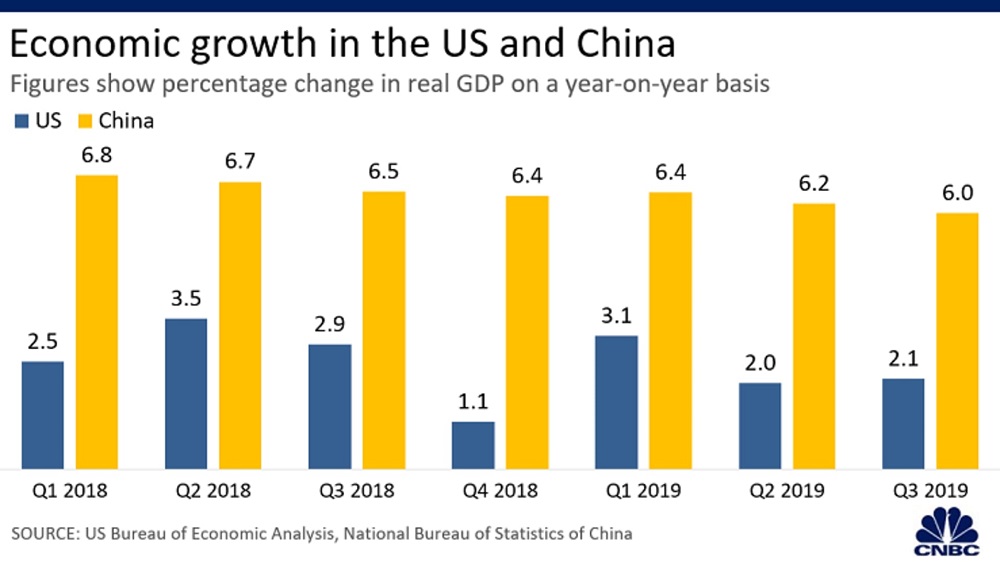
Economic growth slows
Growth in gross domestic product — the broadest measure of an economy — slowed down in both the U.S. and China last year.


Trade volume declines
Overall exports and imports fell in both countries in the first ten months of 2019, compared to a year ago. That came amid slower trading activity worldwide — a trend some experts said started even before the U.S.-China trade war.

Manufacturing downturn
The manufacturing sectors of the U.S. and China have felt the pinch of a slowing global economy, which was made worse by the trade war between the two countries.

Retail sales steady
Consumer spending in the U.S. and China were among the bright spots of their respective economies in 2019, supported by a steady labor market in both economies.

Currency movements
A relatively strong U.S. economy and investors’ preference for safe-haven assets increased demand for the greenback, lifting the currency’s value for 2019.

Stock market rally
In financial markets, rate cuts by the Federal Reserve and receding trade war tensions during certain periods in the year supported investor sentiment and sent stocks on Wall Street to multiple new highs this year despite weak corporate earnings.

Over in China, the inclusion of Chinese stocks into major global benchmarks helped the Shanghai Stock Exchange Composite Index to record a double-digit climb in 2019.