The U.S. and China are entangled in a trade war, and that’s hurting business and economic activity worldwide. One year on, a resolution is still nowhere in sight. In a poll conducted by Reuters, around 80% of more than 60 economists responding said they expect the U.S.-China trade fight to either worsen or stay the same by the end of 2020. The two countries share $660 billion in trade between them in 2018, according to the U.S. Census Bureau, and here are four charts that show big ways that commerce is changing.
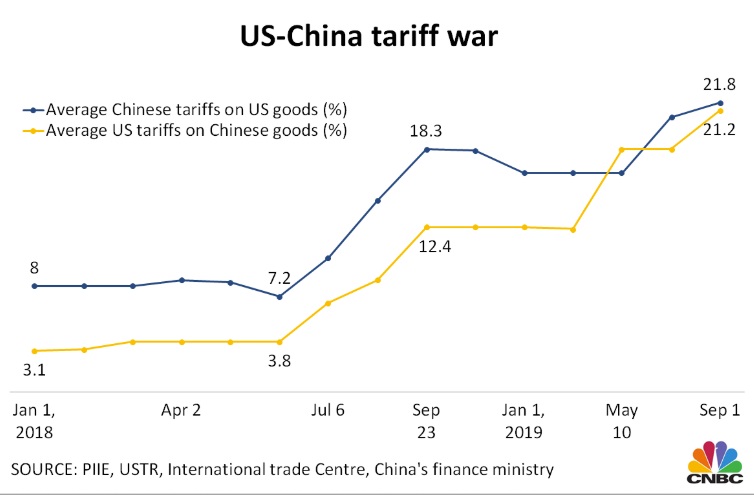
Rising tariffs
The first trade salvo was fired by the U.S. in early 2018, but the bilateral trade war between the U.S. and China really kicked into a higher gear in July 2018. That month, the U.S. imposed 25% tariffs targeted at $34 billion worth of Chinese goods. In response, Beijing hit back with higher duties on $34 billion of American products. Tariffs have continued to climb since.
Slowing US-China trade
The United States and China were each other’s top trading partner in 2018, but Mexico and Canada surpassed China to become the top two U.S. partners this year.
US trade deficit with China
The U.S. runs the largest trade deficit with China — a point that President Donald Trump has used to justify tariffs in the first place.
US soybean exports to China
Soybeans are one of the main products the U.S. sells to China. And now they’re in the crossfire. Farmers are among the largest supporters of Trump. And China, the world’s largest buyer of several agriculture products including soybeans, has used reduced purchases of some farm products in an attempt to punish American farmers and put pressure on the U.S. president.
