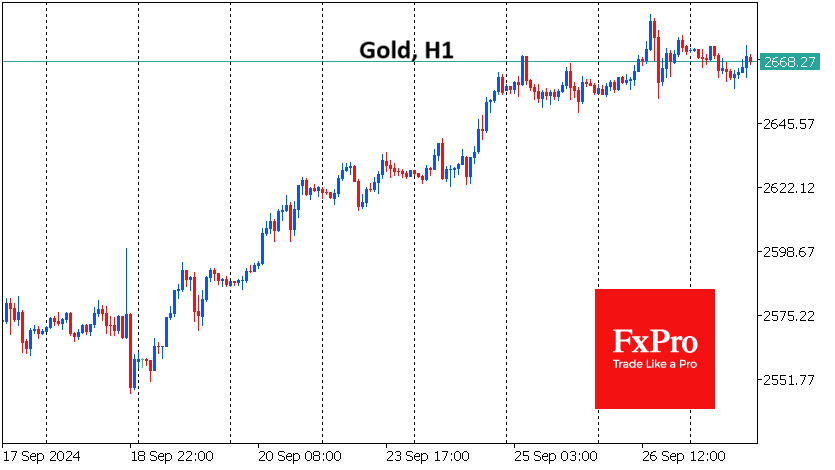
Gold has hit all-time highs on each of the last six trading days. Thursday’s touch of $2685 followed the strongest selling momentum since 18th September, when initial profit-taking expanded following the release of strong GDP growth estimates.

Short-term intraday profit-taking is both fuel for further gains and a sign of uncertainty at this stage of the market. Technically, gold has already crossed above the 161.8% level of the two-year rally since August 2018 – a typical rally extension pattern along Fibonacci levels. When the price has moved so far into the area of historical highs, it becomes more difficult to find new upside targets.
More attention is now being paid to looking for signs of overbought conditions. On the weekly timeframe, the RSI index is approaching the overbought level of 80. This is only the sixth time since 2008 that the index has entered this territory, with corrections of 6-20% following. The last percentage was 6% at the end of last year, but the others were much higher. In 2011, this overbought area locked in a price peak for the next nine years.
Gold’s strong rally over the past three weeks is the most dangerous part of the trend for short-term sell-side traders who get involved in selling without reliable signals. On a weekly timeframe, such a signal would be a negative weekly close. We will get this signal next Friday at the earliest. The publication of monthly data on the US labour market will reinforce its importance for the markets.
The FxPro Analyst Team