It may be hard to believe, but the US currency is gradually turning the tide in its favour. Such a calm recovery may well be a concentration of forces (liquidity) before a new phase of decline for the US currency.

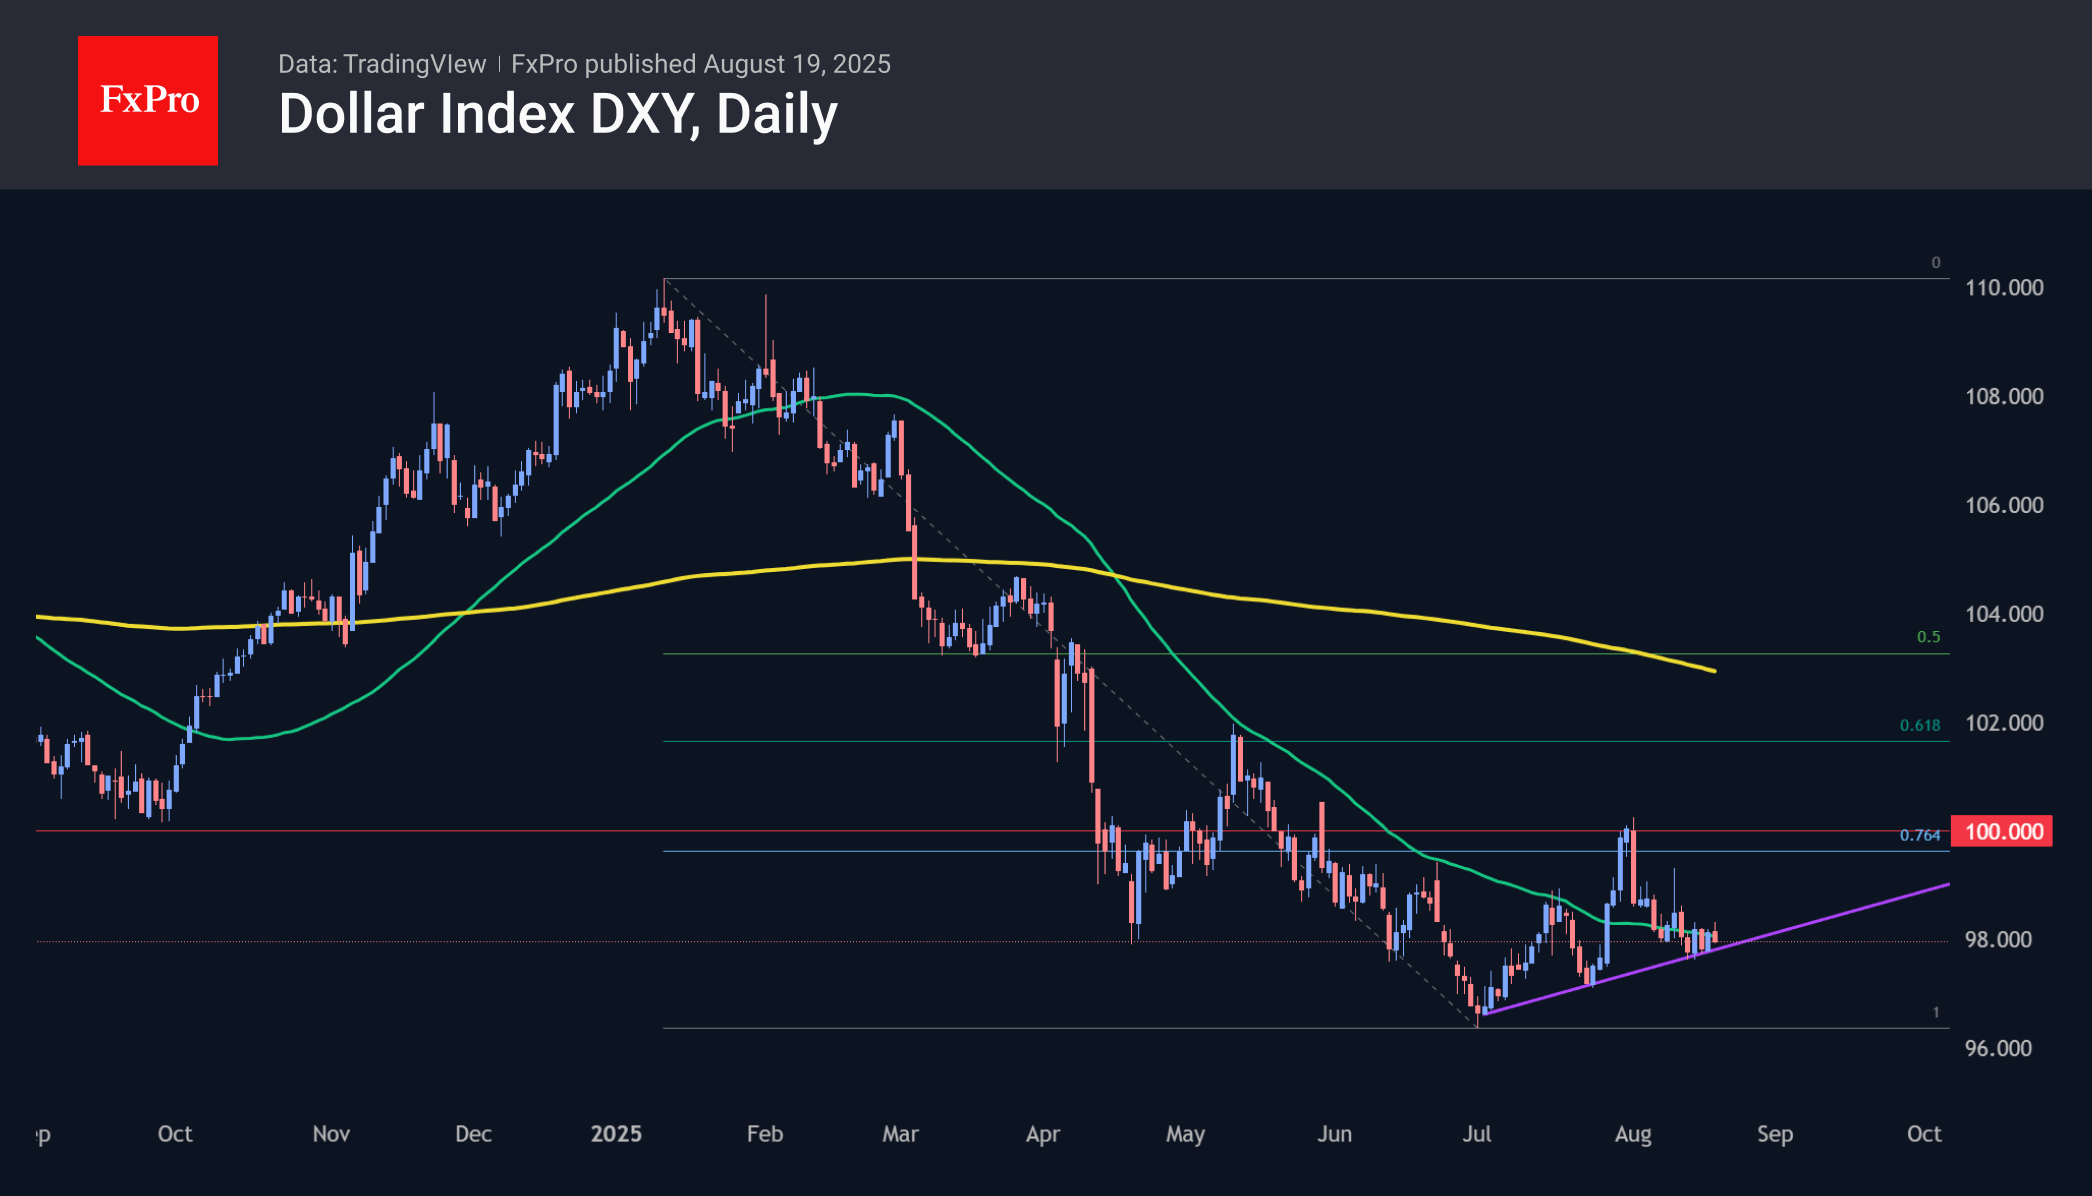
The dollar index reached its lowest point in this cycle on 1 July at 96.00. After that, we saw two impulses of growth and decline, and each time there were higher local lows and higher local highs. A support line passes through the lows, the last touch of which was on 15 August.
Also, over the past month, the downward trend has been broken, with the local high exceeding the peak levels of June.
For most of August, the dollar has been moving around its 50-day moving average, mostly above it. This is a significant change, as from February to July, this downward line acted as local resistance, and approaching it intensified the sell-off.
Also on the bulls’ side is the dollar’s oversold condition from its six-month decline and the touching of three-year lows.
Several fundamental factors are working in favour of the dollar. First, inflationary risks are mounting, including a shock PPI and accelerating consumer service prices. The data has swung expectations less dovish: markets are pricing in a 17% chance of the rate being held in September, although on 13 August, they were completely confident of a 25-basis-point cut and a 6% chance of a 50-basis-point cut. This revaluation is working in favour of the dollar.
Another fundamental factor is trade flows. At the beginning of the year, America sharply increased imports, seeking to avoid the introduction of tariffs. Now, imports are in sharp decline, compared to the background of full warehouses and less favourable prices for buyers. Temporarily, this abruptly shifts the influence of the trade balance in favour of the dollar.
However, it is too early to talk about a long-term change in the trend. We will be able to say this with greater certainty when (and if) the DXY exceeds 100 (+2.2% from the current 97.8), recovers above the 2023–2024 support level, and exceeds the 76.4 Fibonacci level from this year’s peak to bottom.
The FxPro Analyst Team