Nasdaq100 has a very similar pattern to what happened in the early 2000s, and the Fed’s behaviour adds to the story.
In a decisive move downwards, the Nasdaq100 closed the third quarter (and the fiscal year in the USA) below its 200-week moving average. The last similar dip was in mid-2008 on the Lehman Brothers bankruptcy.


However, a look at the chart finds more analogies to the period of the deflating dot-com bubble. And that’s bad news for the bulls. Earlier this year and 21 years before, inflated company valuations deflated intensely. Fundamentally, in both cases, the downward movement was supported by unusually aggressive policy tightening from the Fed after a long period of the extreme soft policy.
Both in early 2001 and in June 2022, the initial decline towards the 200-week average was met with buying. Just over three months ago, investors thought that technology stocks had sufficiently corrected and that the regulators could proceed more cautiously. But the latter did not happen, and the market’s recovery choked. A fortnight ago, the Nasdaq100 closed below its 200-week average. Attempts to start the week and the new quarter with heavy buying were choked, and the index returned under that important line by the end of the week.
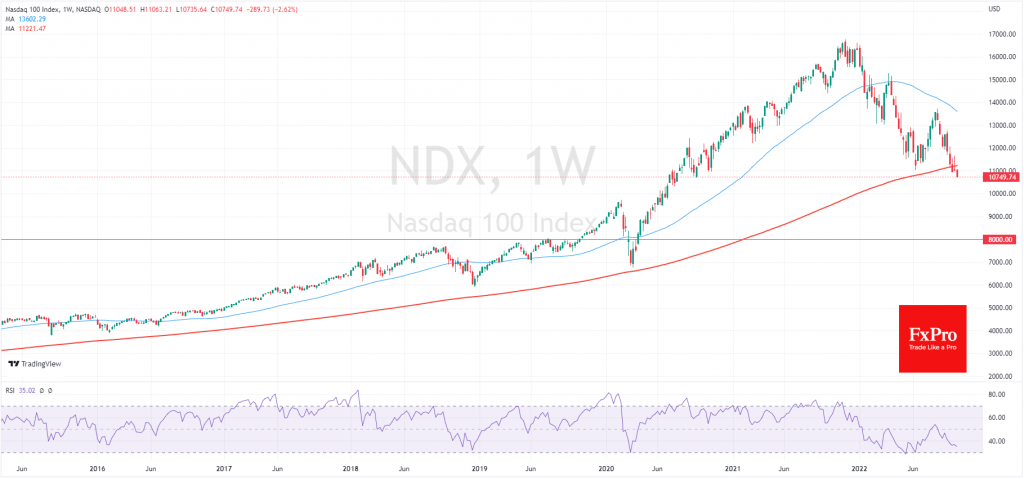
In 2001, a decline below the 200-week average was followed by a drop of over 60% before it hit bottom, and in 2008 it fell as much as 40% before it reversed upward. From today’s levels, it would fall to 4000 for the former and 6800 for the latter. Right now, both of those scenarios look overly pessimistic.
In the early 2000s, the selling stopped when the Nasdaq100 pulled back to 900, which was the start of the most intense dot-com bubble inflation. Now the 7700-8000 area looks like a similar level, which would “deflate” about half the index’s valuation from the peak and just over 25% from current levels.
Watching the Nasdaq drop 1.5% since the start of the day today, it is easy to be a bear. Still, it is worth waiting for this week to close well below the 200-week average, for, in 2010, the index got support after a touch this line. In 1990, a fall below that line took 14% off the index in five weeks before it reversed to growth.
The FxPro Analyst Team