
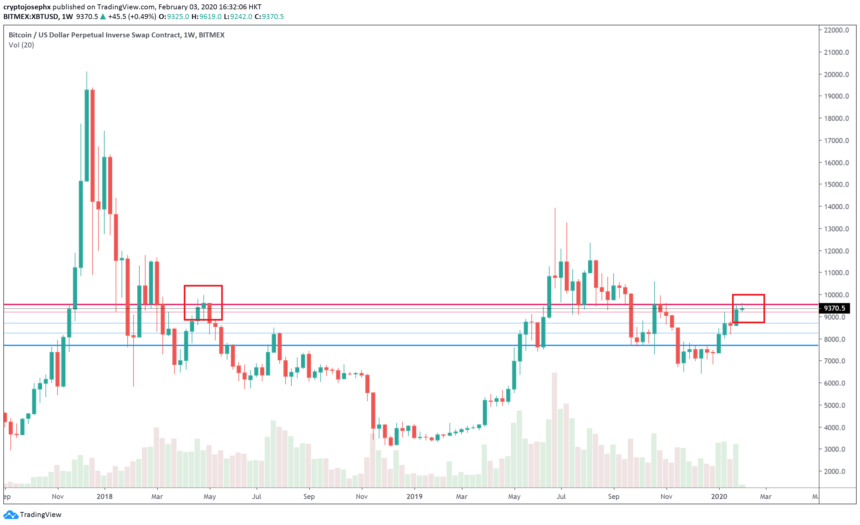
The bitcoin price rejected $9,500, a multi-year resistance it has been teasing with throughout the past two weeks. The last time it rejected at this level in a similar pattern, it dropped to the $6,000s. In the first half of 2018, the bitcoin price struggled to recover following its correction from $11,500. It stayed within a range in between $6,500 and $9,500 for seven months, rejecting every attempt to break out of the $9,500 resistance level.
If the current price trend of bitcoin plays similarly as the 2018 fractal, it is likely to reject at $9,500 and result in the resumption of the bearish trend. For that to happen, the weekly candle for February 3 to 9 would have to act as an evening star candle, and sell-off in the second week of February.
As explained by prominent technical analysts like Cred, bitcoin is now in an indecisive zone wherein it is not clear whether it is ready to break out of the $9,500 resistance level or break below key support levels. A break above $9,500 would mean a retest of the $10,500 weekly high the bitcoin price hit in October 2019. Contrary to that, a hard rejection at $9,500 would result in the retest of $8,700 and possibly lower range levels including $7,700. This scenario would require the current weekly candle to close as an evening star and maintain a bearish formation. As such, while possible, it is not a definitive confirmation of downtrend.