Oil experienced intense pressure on Monday, but the price of natural gas continued its upward trend. This contrast is due to an under-supply of Russian gas to the European market and more speculation around Iranian oil, which could quickly add more than 1m BPD. That said, macroeconomics is now on the side of the energy bears, with only geopolitics temporarily feeding the bulls.

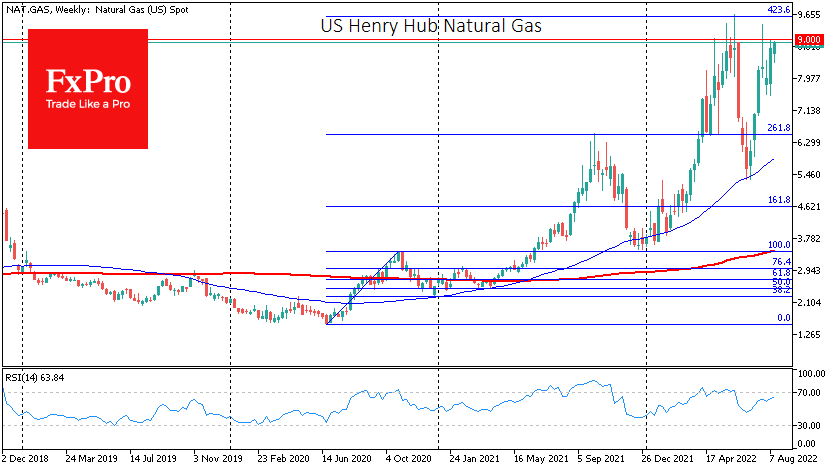
Gas prices in New York are approaching $9 per million British thermal units (1M BTU). This is the area of the May-June highs. A steadily higher price was last seen in 2008. But these high prices have little to do with what Europe now faces.
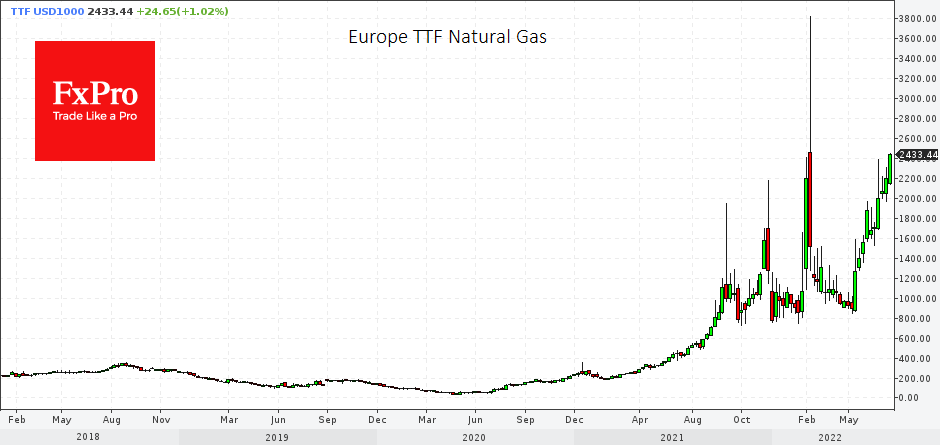
Gas prices in Europe have surpassed $2,500 per 1,000 cubic metres, the highest since March 8. Europe and America are different markets, and it is not correct to compare prices directly. For example, converted to US standards, current prices at the Dutch hub are close to $70 per 1M BTU. That is 7.8 times higher than in New York. By comparison, in mid-2018, when there was a lull in this market, the difference was 2.6 times.

It is logical to expect that the price difference between Europe and the USA will narrow on both sides, which implies an increase in the USA and a decrease in Europe. But it is worth looking at the first and easiest substitute for gas – crude oil.
Europe is working hard to increase the world’s oil supply, with efforts to conclude the Iran nuclear deal. Yesterday’s news on the subject sent Brent nearly 5% down to $92.2 and WTI to $86.30, its lowest level since the end of February, reflecting a market surplus.
The downtrend in oil prices, which has lasted for more than two months, suggests that right now, we may be witnessing nothing more than a speculative attack on gas, inflating a bubble in its final stages. Experience suggests that in such cases, we see a sharp acceleration before the bubble bursts with a bang. With the Gas case, we should be prepared for prices in Europe to surpass $3000 and in the US to break through $10 before the final downward reversal.
The FxPro Analyst Team