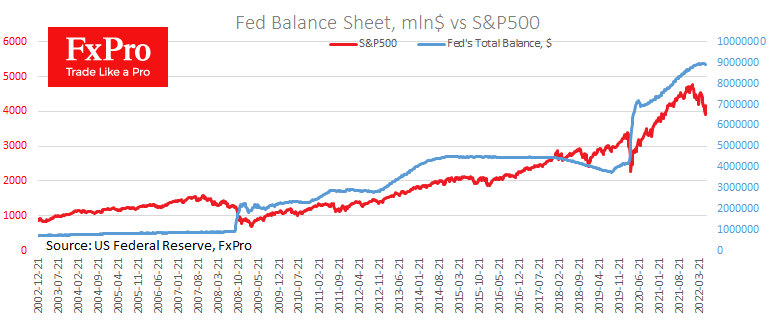
With the start of June, the Fed was due to start selling assets off the balance sheet. However, balance sheet values peaked at the beginning of April when they were 50 billion higher than the latest figures.

The S&P500 had turned downwards much earlier, in the early days of the year, but its downward movement accelerated precisely on the days of the Fed balance sheet peak. That was the start of one of the most extended series in the history of six back-to-back weekly declines.
This is fundamentally different from 2018, when the US equity market became more volatile, with several significant drawdowns but quick reversals to growth due to the solid macroeconomic fundamentals.
Equity and bond markets are communicating vessels, even if their communication is not perfect. From this perspective, the emergence of a systematic seller in the form of the central bank will push prices down, just as balance sheet purchases pulled stocks up in 2020 and 2021.
As we can see, even the slippage with the Fed’s balance sheet increase has caused pressure on the market. The move into an active selling phase promises to be even more stressful for equities and bonds in the coming weeks, forcing a cautious view of the near-term prospects for the markets.
For medium-term investors, a more sensible strategy may be to wait for market participants to come to terms with the new reality, where money is not free and the balance sheet is shrinking.
The FxPro Analyst Team