The US equity market continued its upward trend, with the S&P500 rising 10.8% in the first quarter, exceeding the historical average gain for a full calendar year. We are even more impressed by the low volatility of the index since the end of January.

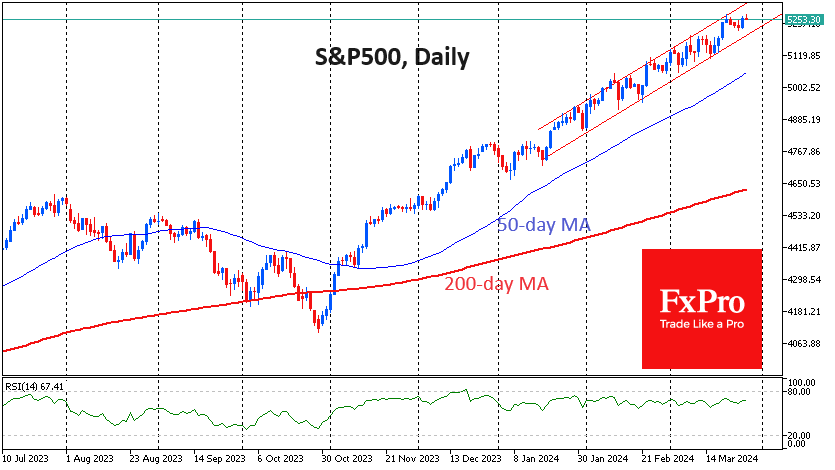
The S&P500 has moved in a range of less than 2.5%. Frequent small market pullbacks provide fodder for further buying. This type of rally is seen in mature bull markets that have had enough of a push off the bottom but are not yet struggling to go higher.
It is also important to note that the current rally is becoming increasingly broad-based. The Magnificent Seven are falling apart, with Apple and Tesla clearly suffering, but the growth is encompassing more stocks. The broadest of the popular indices, the Russell 2000, broke out to its highest level since January 2022 on Thursday. However, it has traded in a broad sideways range from April 2022 to February 2024. This is an important sign of the health of the whole stock market, not just a set of popular investment narratives.

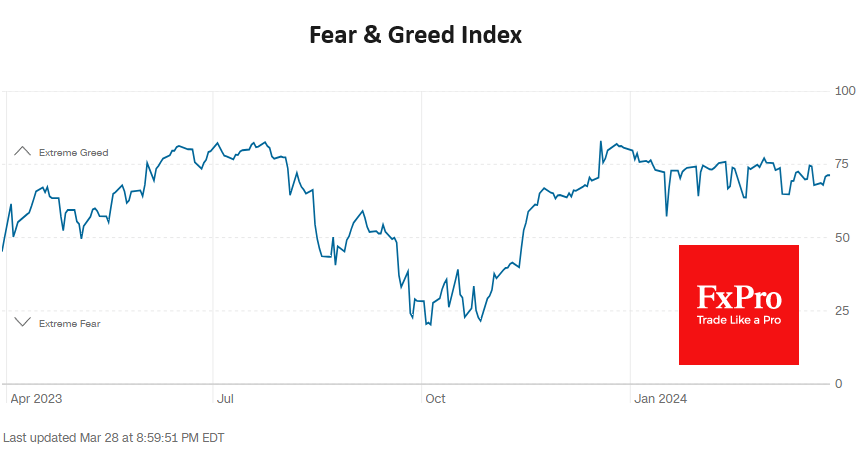
For four months, since the second half of December, CNN’s Fear and Greed Index has hovered near “extreme greed”, although most of the time, it has been just below that line. It is very close to the edge, with a solid bullish trend remaining, but without the market overheating, so there is no need to let off steam.
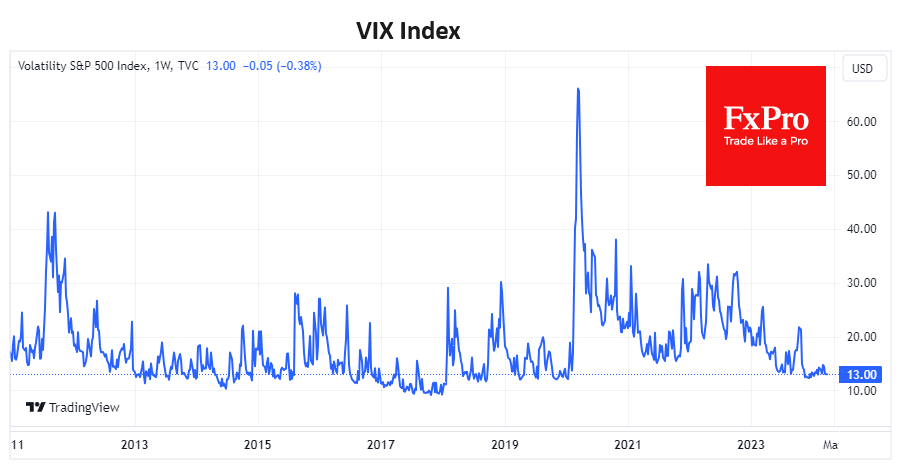
The VIX implied volatility index is at levels typical of much of 2018 and 2019, giving no hope of an imminent end to the upside. The entirety of 2017 saw the VIX below current levels, so it would not be fair to call this an anomaly.

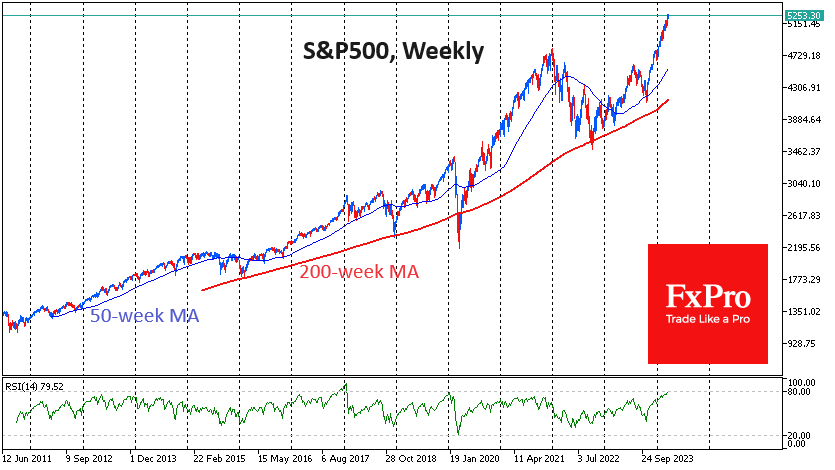
We have seen similar amplitude dynamics in the S&P500 from August 2017 to January 2018, April to September 2018 and October 2019 to February 2020. The duration of these episodes ranged from 4 to 6 months, but the growth was interrupted by changing external circumstances, from trade wars to a pandemic.
On the weekly timeframe, the RSI is approaching 80, a strongly overbought zone. When it touched this level in January 2020, a strong bearish sentiment formed, and we saw a small correction even before we started to fear a pandemic. But there’s another example: from November 2017 to January 2018, the RSI was above 80, and the S&P500 rose more than 9% to its peak.
All in all, the rise in the S&P500 doesn’t look excessive. The market isn’t overheated and isn’t about to collapse under its own weight. However, investors should be aware of any external circumstances that could damage the economy, as the equity index could very quickly revise equity expectations and trigger a deep correction.
The FxPro Analyst Team