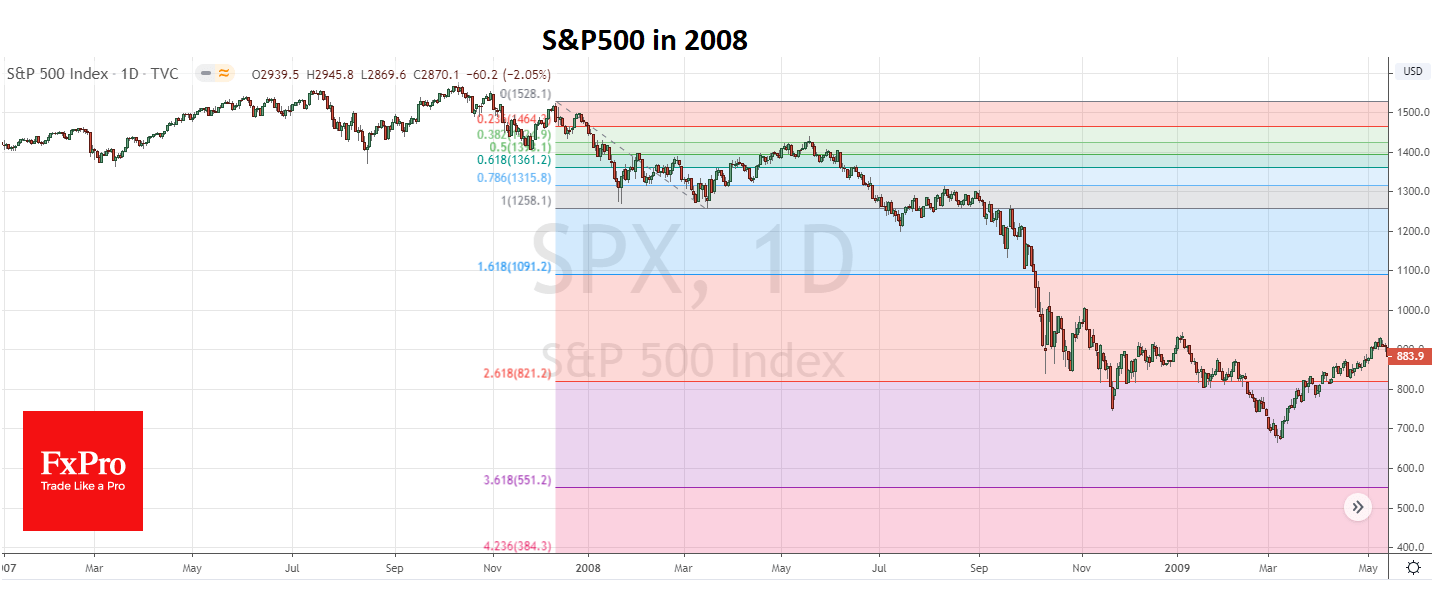
The S&P500 climbed by 36% over the period of harsh quarantine, from the March bottom to the highs of April. Due to this rebound, the index offset 65% of the decline from the peaks of February. However, the stock’s recovery stalled. It may well turn out that it is worth comparing the March collapse of the markets not with October 2008, but with the decline of the US Indices from November 2007 to March 2008. And it means that much deeper fall is to come. Both at that time and now the Fed had enough room for manoeuvre to bring markets back up.

In 2008, the Fed and JPMorgan Chase agreed on financing for the troubled Bear Stearns bank. Then it brought the markets back to growth for exactly two months. During this time, S&P500 has added 13%, winning back more than half of the downward dynamic from October to March.
Later, however, by the end of that May, optimism started to meltdown. In 2008, the worst for the markets was the realization that the problems are far beyond the banking industry. As a result, the index found its bottom only after 2.6 times deeper decline than the first wave from October 2007 to March 2008 – precisely at Fibonacci levels.
The application of the same model shows that the S&P500 index may sink to 230 (!), which is 93% lower than the peak. These are the lows last seen at the end of 1987. It looks like a unbelievable drop.
On the other hand, it is no more fantastic than negative oil prices, negative rates, and more than 20 million jobless growth in just one month, to its all-time highs in the postwar period. Approximately the same 90% the Dow Jones lost approximately the same, 90% from the peak before bottoming out on the Great Depression. Therefore, it’s technically impossible to deny this option.
It should by no means be considered a forecast, but only a warning that the worst for stock markets may be ahead, as the economy remains on the trajectory of sharp decline.
The stocks are supported by the demand for cheap securities that were strong in the past. However, the current market has not changed in any way. During crises, a multi-year growth paradigm is often broken, and the behaviour pattern is fundamentally changed. People have already changed their model, but markets have not yet. Plainly speaking, it is extraordinary to see this. Right now, investors have not yet started to spend their savings and still believe in eternal market growth. However, this is a dangerous misconception refuted by more than three years of a downward trend after the dot-com boom, 1.5 years of global financial crisis decline (since 2008), and ten years of the sideways trend since the 1970s.
The FxPro Analyst Team