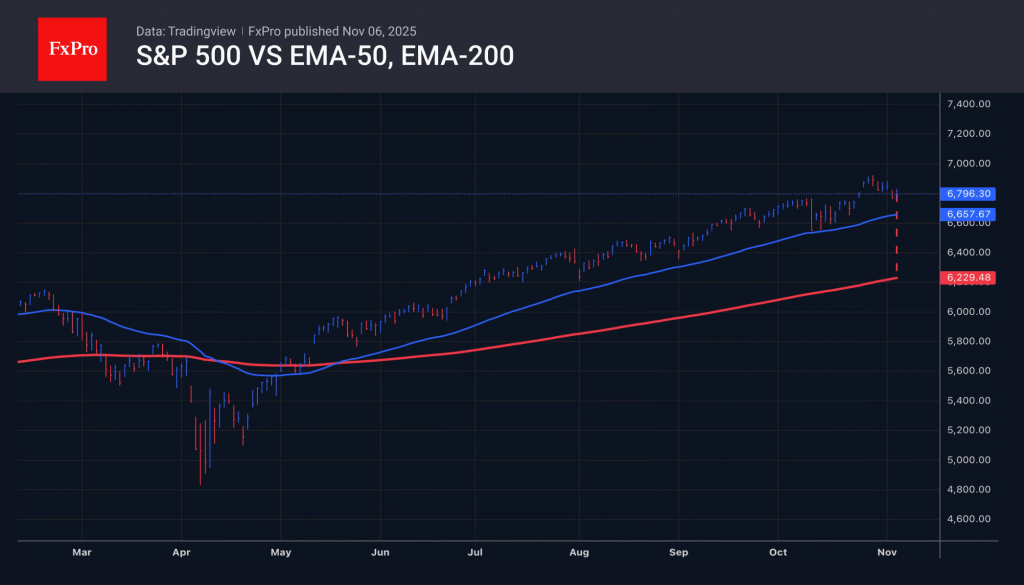
After reaching a 36th record high at the end of October, the S&P 500 took a few steps back, cooling off after overheating. The spread between the broad stock index and the 200-period moving average is 13%. In the past, such an extreme difference did not last long and ultimately led to a pullback. Since April, the market has not fallen below the 50-day moving average and has not declined by more than 3%.

The third-quarter corporate reporting season is coming to an end. The magnificent seven are set to report 27% profit growth. This is twice as strong as forecasts, but it is already factored into prices. The broad stock index needs a new driver to continue its rally. Without new positive impulses, investors are focusing more attention on previously ignored negatives. The colossal costs of technology giants may not pay off, and the Fed may surprise investors with a slow rate cut.
Investors are increasingly drawing parallels with the dot-com bubble that burst in 2000. As is the case now, back then, the fundamental valuations of the S&P 500 were also overestimated. The broad stock index is trading at 23 times its expected earnings over the next 12 months. The average value of the indicator is 20. Schiller’s Price-to-Earnings ratio has reached 40 for the second time in history. In such conditions, the probability of a correction in the US stock market is very high.
The FxPro Analyst Team