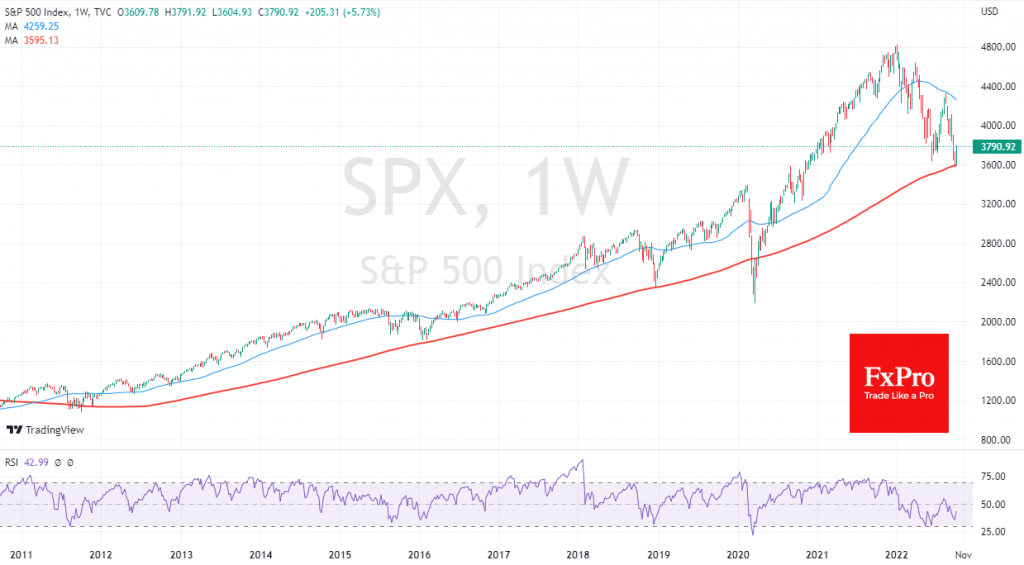
S&P500 index futures are trading 6% above the lows set at Monday’s start of the day. Such a solid start for the new month, quarter and financial year in the US is helped in no small part by the low base, as the index ended September at the lows since November 2020, below the 3,600 mark.
The powerful two-day rally suggests that we could see the start of more than just a portfolio shakeout at the start of a new period.

On the bulls’ side, there is another revival of hopes that the monetary watchdogs in the USA and other developed countries will slow down their policy tightening.
The “worse is better” rule was in full effect in the markets yesterday. Markets treat the sharpest drop in job openings as a possible excuse for the Fed to move from a 75-point rate hike to a 50-point step. However, such hopes are overly speculative for a couple of days. There will be official labour market data to which the Fed is paying much more attention.
Nevertheless, we note that the buyers in the S&P500 appeared just after touching the significant 200-week moving average, which was near the 3600 level. The market bounced back from this curve in 2018, 2016 and 2011. A correction towards the 200-week moving average made the stock an attractive buy in all those cases and in the long period from 1980 to 2001. This is how the market tries to stay within the patterns formed after the global financial crisis. In 2020, the panic of covid uncertainty took the market lower, followed by a robust response from governments and central banks that returned the markets to growth within weeks.
In addition to the 200-week average, the stock was helped by the oversold conditions over the past few months, where so many sellers were piling up that it was difficult to find new ones.

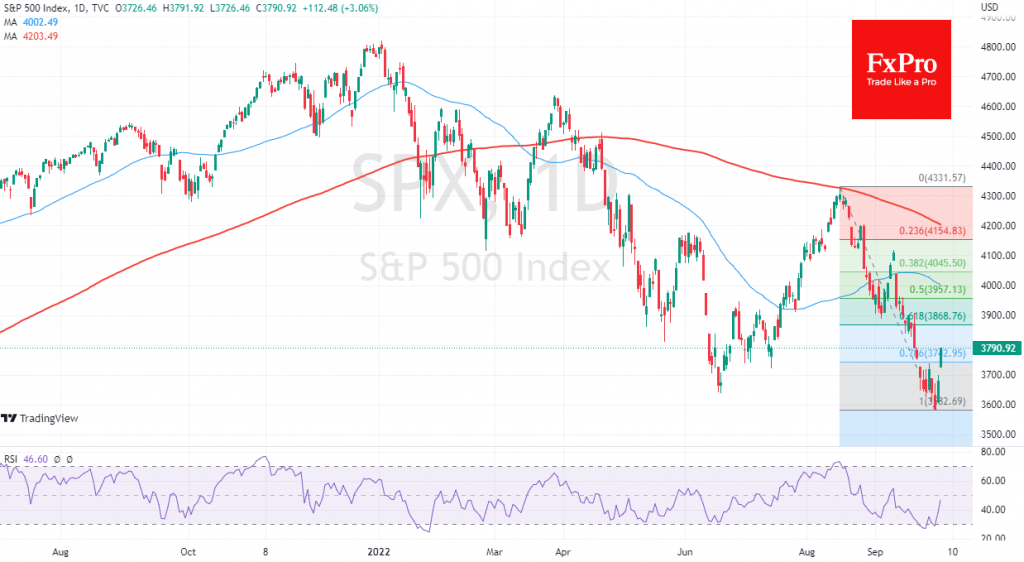
However, the bull market has yet to prove itself. Moving from the weekly to the daily chart, we can see that the last sell-off started in mid-August and failed to get above the 200-day MA. The first technically solid sign of a break of this trend would be for the S&P500 to consolidate above 3900 (61.8% of momentum).
The potential buyers should pay more attention to the index’s performance around 4000, where the 50-day average is hovering, and around 4200, with the 200-day average near. Only firm buying from these levels will indicate that we are witnessing a fundamental reversal of the market sentiment and not a rally in the bear market. In turn, only a change in the tone of the Fed and other central banks could perhaps support such buying.
The FxPro Analyst Team