Oil ended last week with growth, having found support at key price levels, but unlikely for long.
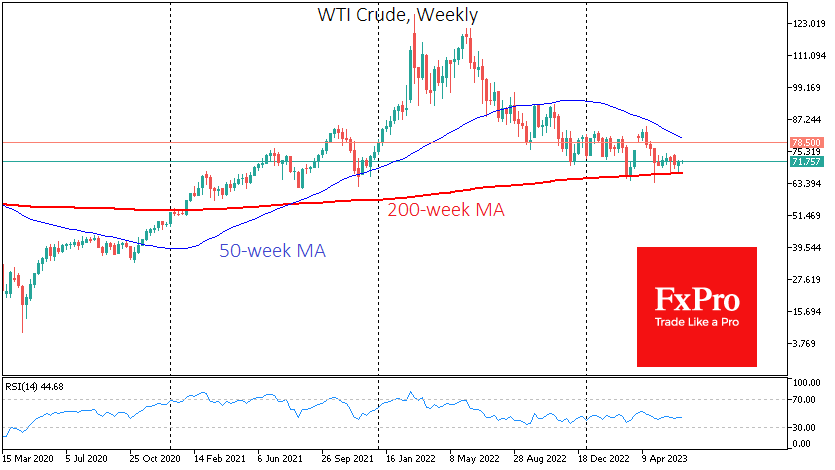
Last week, WTI tested its 200-week moving average for the fifth time since the beginning of the year but managed to bounce back from this level. Accumulated oversold conditions in oil on the intraday timeframe and hopes of demand stimulus in China worked in favour of the bulls at the start of the week. In the second half of the week, a falling dollar and demand for equities supported interest in risk assets, including oil.

In addition, it was easy to see the desire of OPEC+ to push oil prices higher by threatening supply shortages. It is essential to realise that we have been hearing such comments for years and that this has kept oil from experiencing substantial price swings.
Weekly data from the US showed that production rose for the second consecutive week to 12.4M BPD, the highest level since April 2020. Commercial inventories rose by 7.9M barrels (+11% y/y). As the driving season approaches, we will likely see a short-term increase in production and inventories.

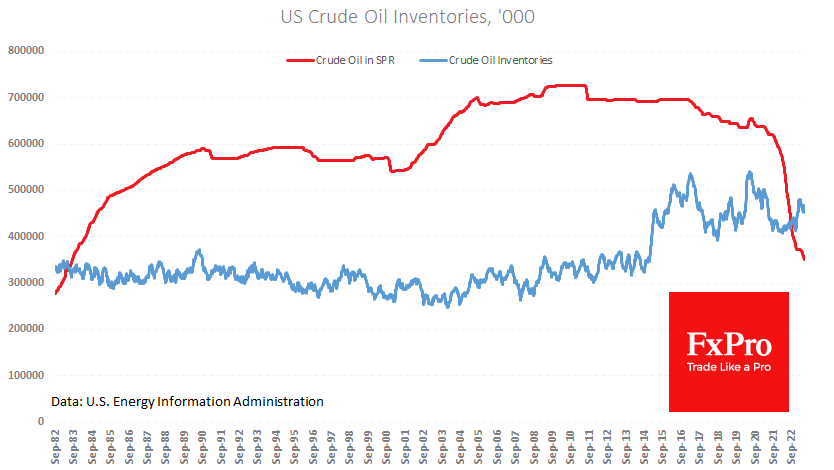
At the same time, oil leaks from the Strategic Petroleum Reserve, which lost another 1.9M barrels that week, down 45% from its plateau just over two years ago with a slightly higher price than in May 2021.
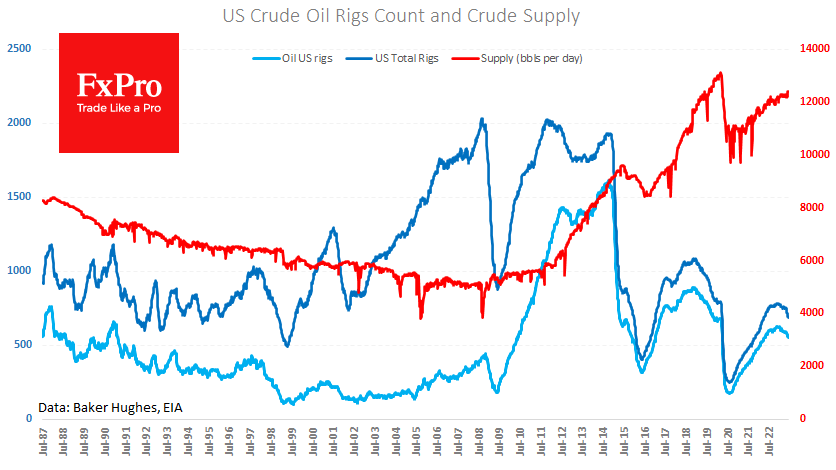
Friday’s weekly data on the number of rigs in operation continued to point to a decline in activity in the sector in the US. The total number (Oil+Gas) fell by seven units to 687, and the number of oil rigs fell to 552 (-4). In both cases, this is the lowest level since April 2022. So far, this decline has not hindered production growth, but it indicates caution on the part of industry participants and keeps oil production well below the maximum of 13.1M BPD we saw in March 2020.

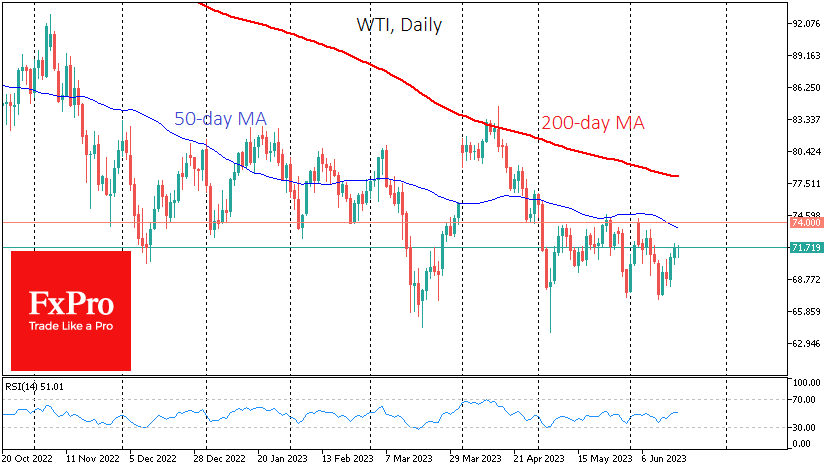
Technically, a rebound in oil may not face headwinds until $74 for WTI and $78.5 for Brent, a significant area of resistance that has previously acted as support. The next more rigid resistance is 78 for WTI and 83.5 for Brent, around the 200-day (50-week) moving average. A move higher would reclassify the current rally as a bullish reversal, but slowing global demand on the back of high-interest rates makes it worthwhile to remain cautious in the longer term.
The FxPro Analyst Team