The price of crude oil fell by 6% on Monday to $67 a barrel for WTI and $71 for Brent. This return to the lows of the last two months is due to Israel’s attack on Iran’s oil capacity. The aftermath and retaliatory rhetoric from politicians in both countries have fuelled speculation that both sides are trying to avoid escalation for now. As a result, the geopolitical risk premium has fallen sharply. The price has returned to levels seen before the latest escalation in the Middle East.

In September, the price was near the lower end of its 40-month range, reflecting the slowdown in the global economy. Chinese stimulus has so far been disappointing in its slowness and limited nature. It will take months for the G10 monetary easing measures to reach the markets and reverse the economic trends in the major developed economies.
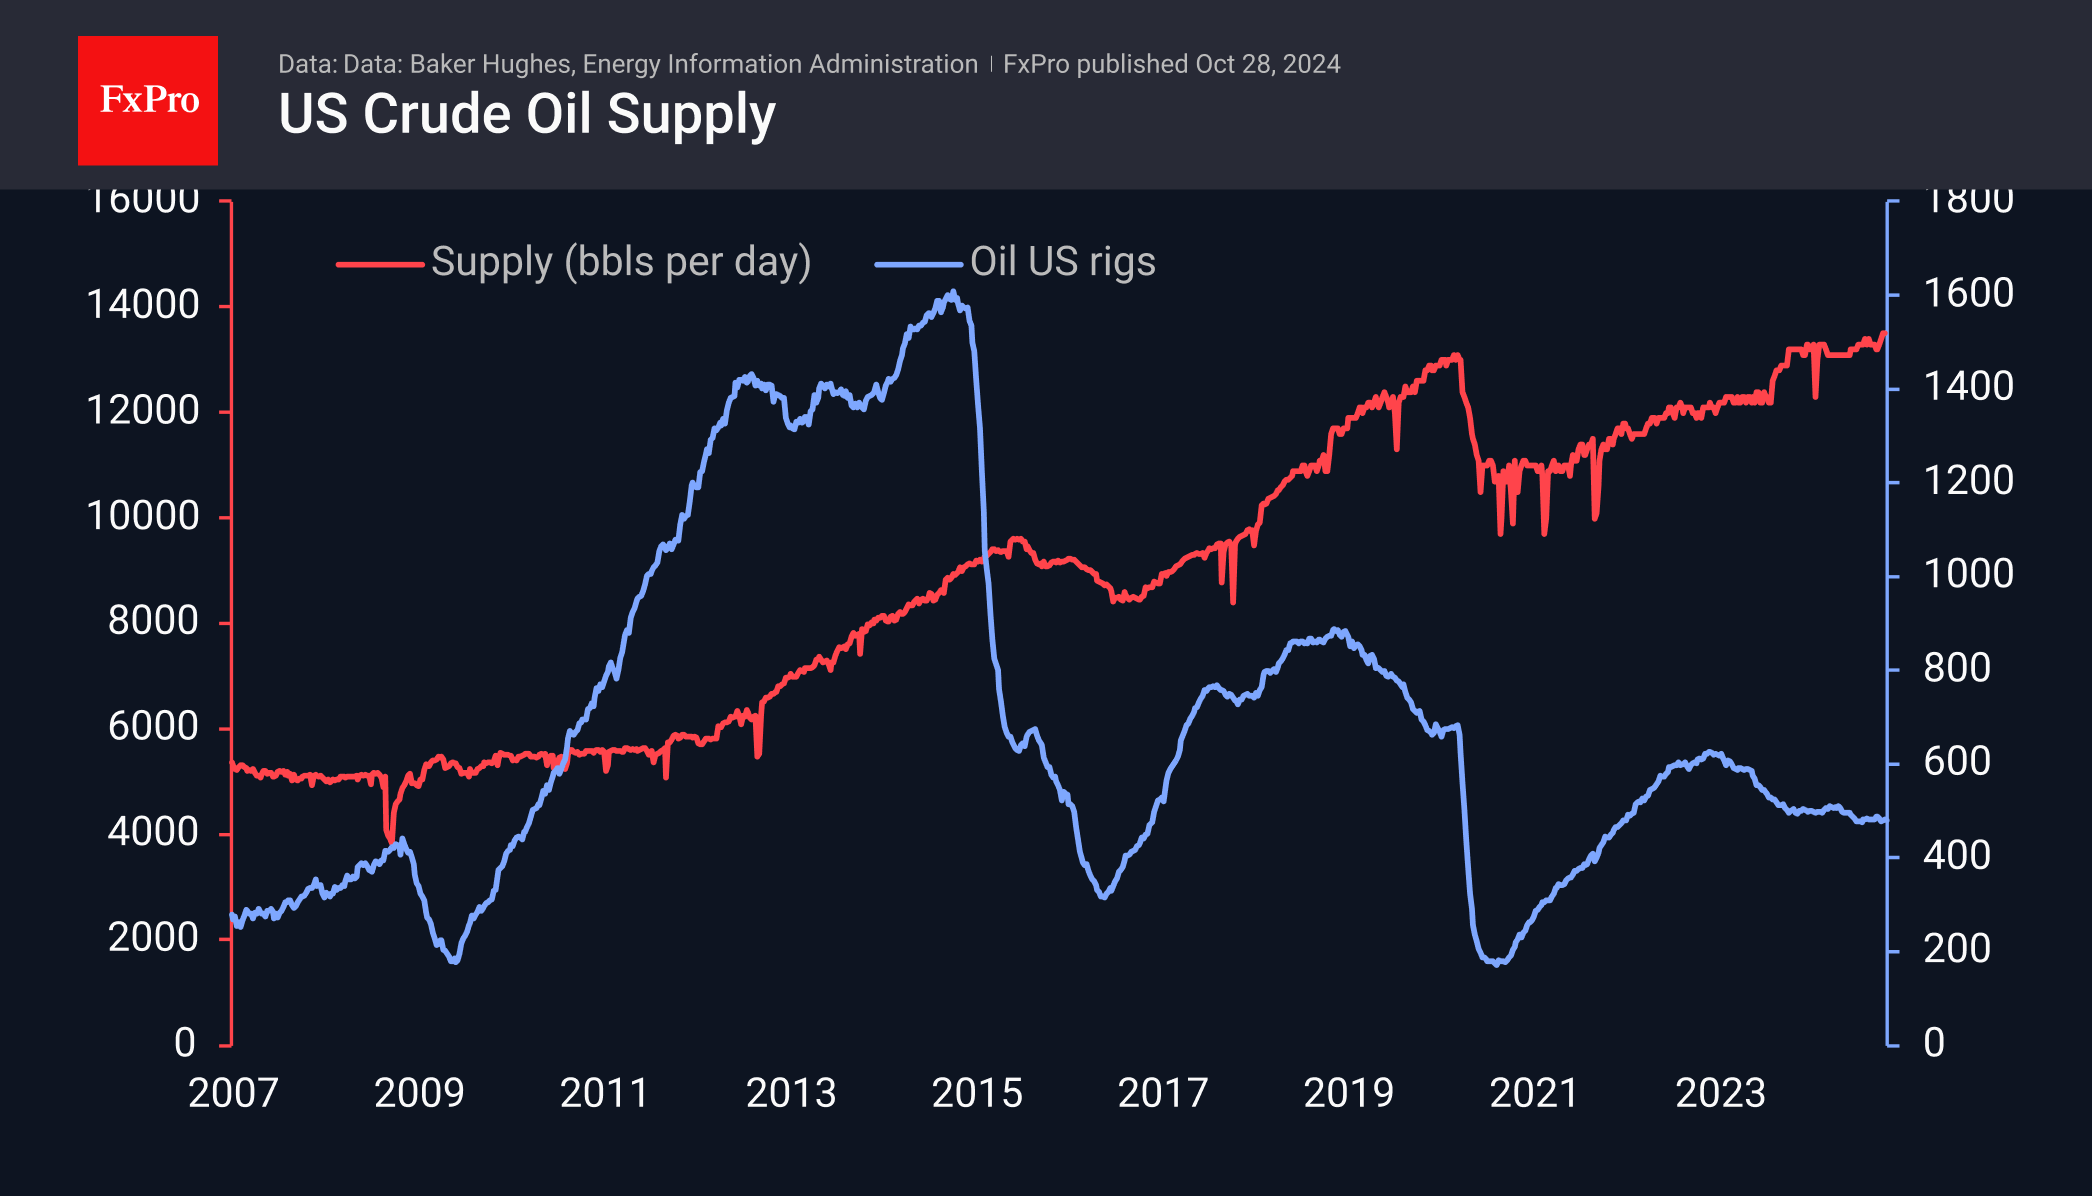
The US continues to produce strongly. Last week was the second consecutive week of record supply from the states, at 13.5 million bpd. At the same time, the number of oil rigs has been falling for almost two years and now stands at 480. The latter indicator is highly correlated with price but has temporarily lost its link with production levels. This is somewhat curious, as it suggests that companies want to squeeze the maximum out of today’s production but limit investment in future production.
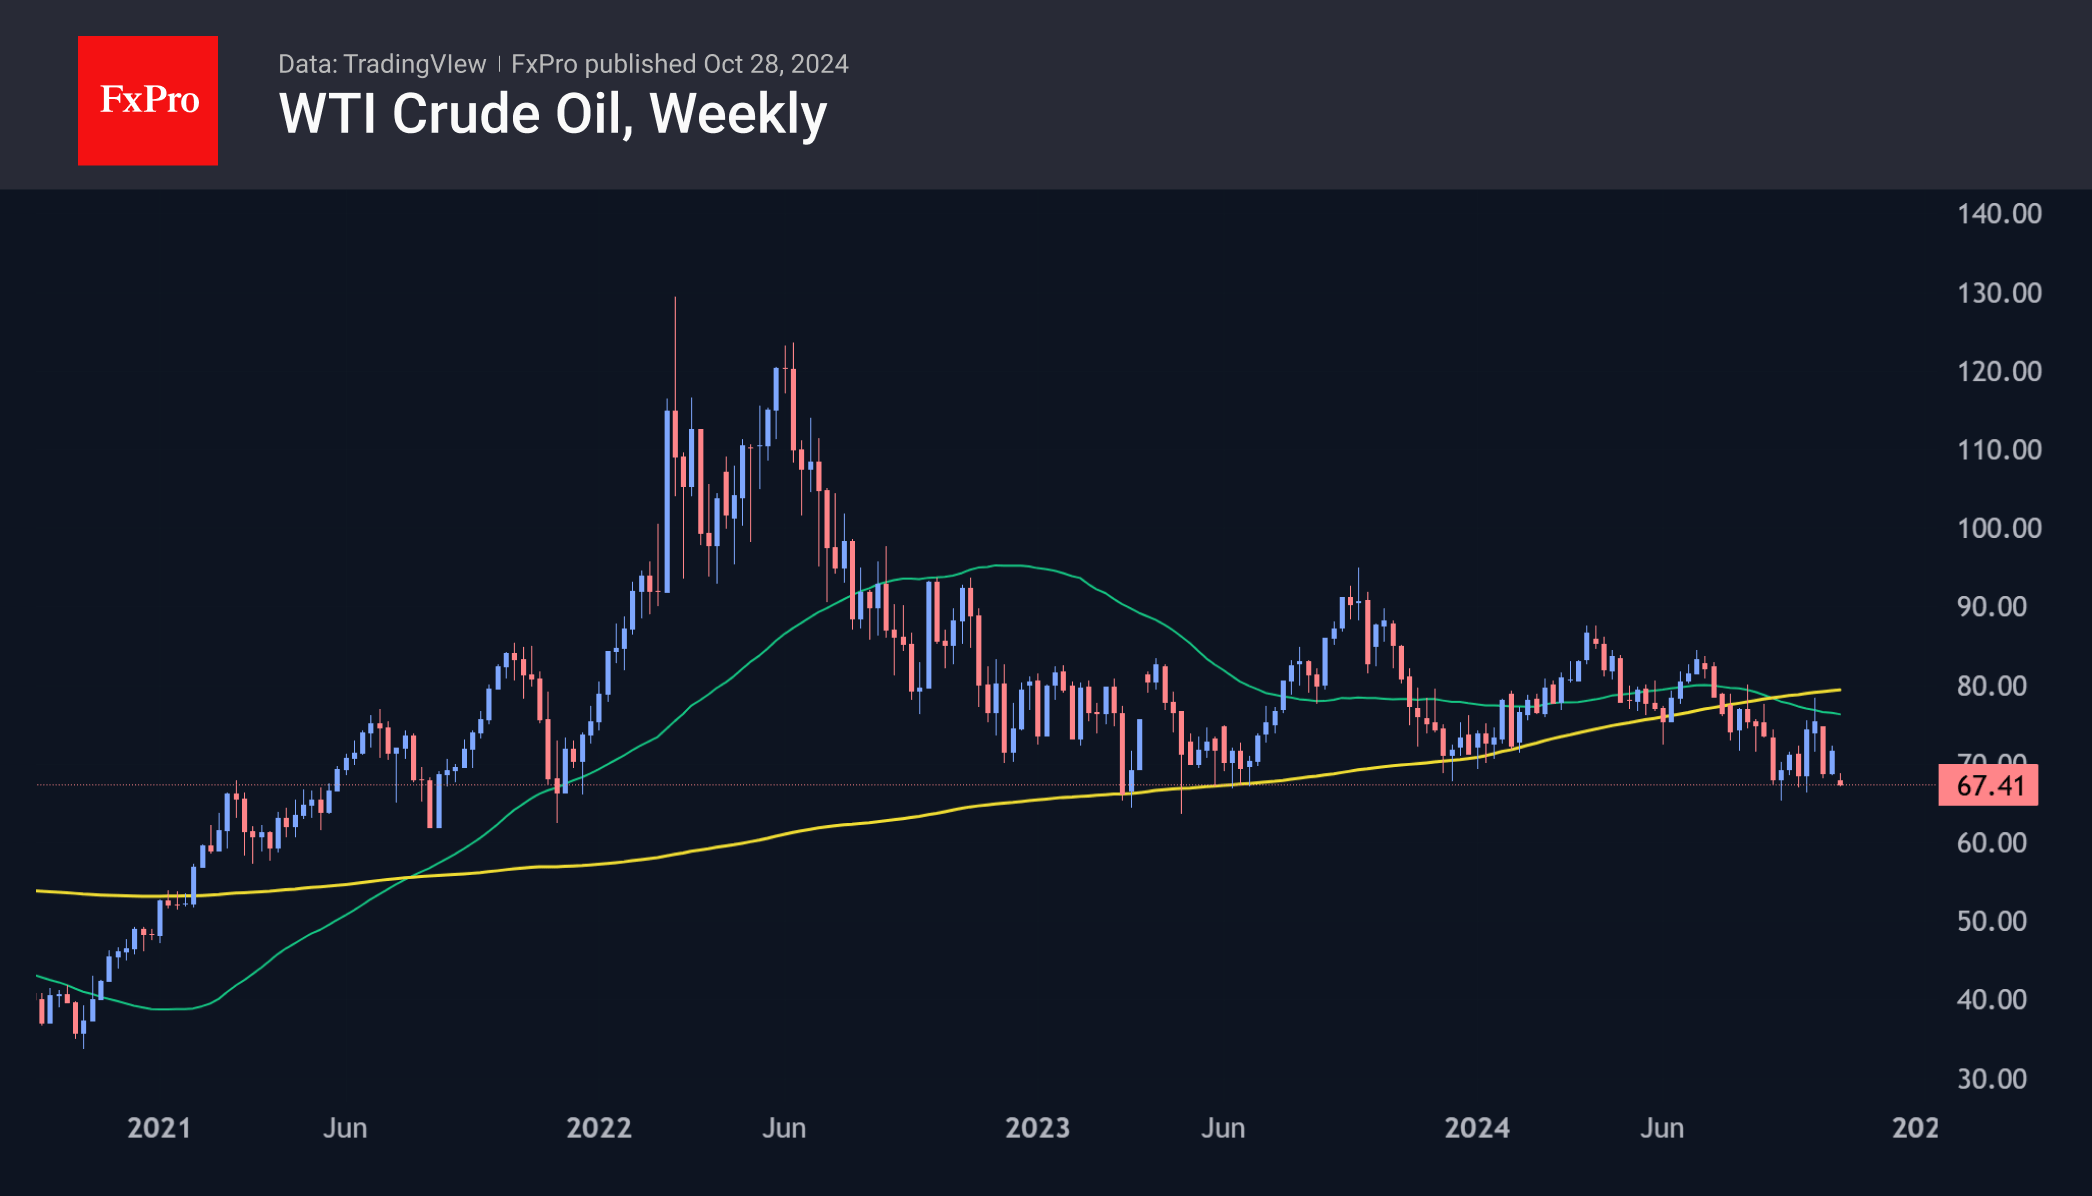
The decline in drilling activity with relatively low inventories might be good news if it were not for the increasing contribution of alternative energy sources to the global energy equation. On the oil chart, the recent fall in prices has tipped the balance in favour of the bears. In October, they managed to keep the price above the 50-month moving average (roughly the same as the 200-week moving average), which had been a key support line since the beginning of the year and was broken in August.
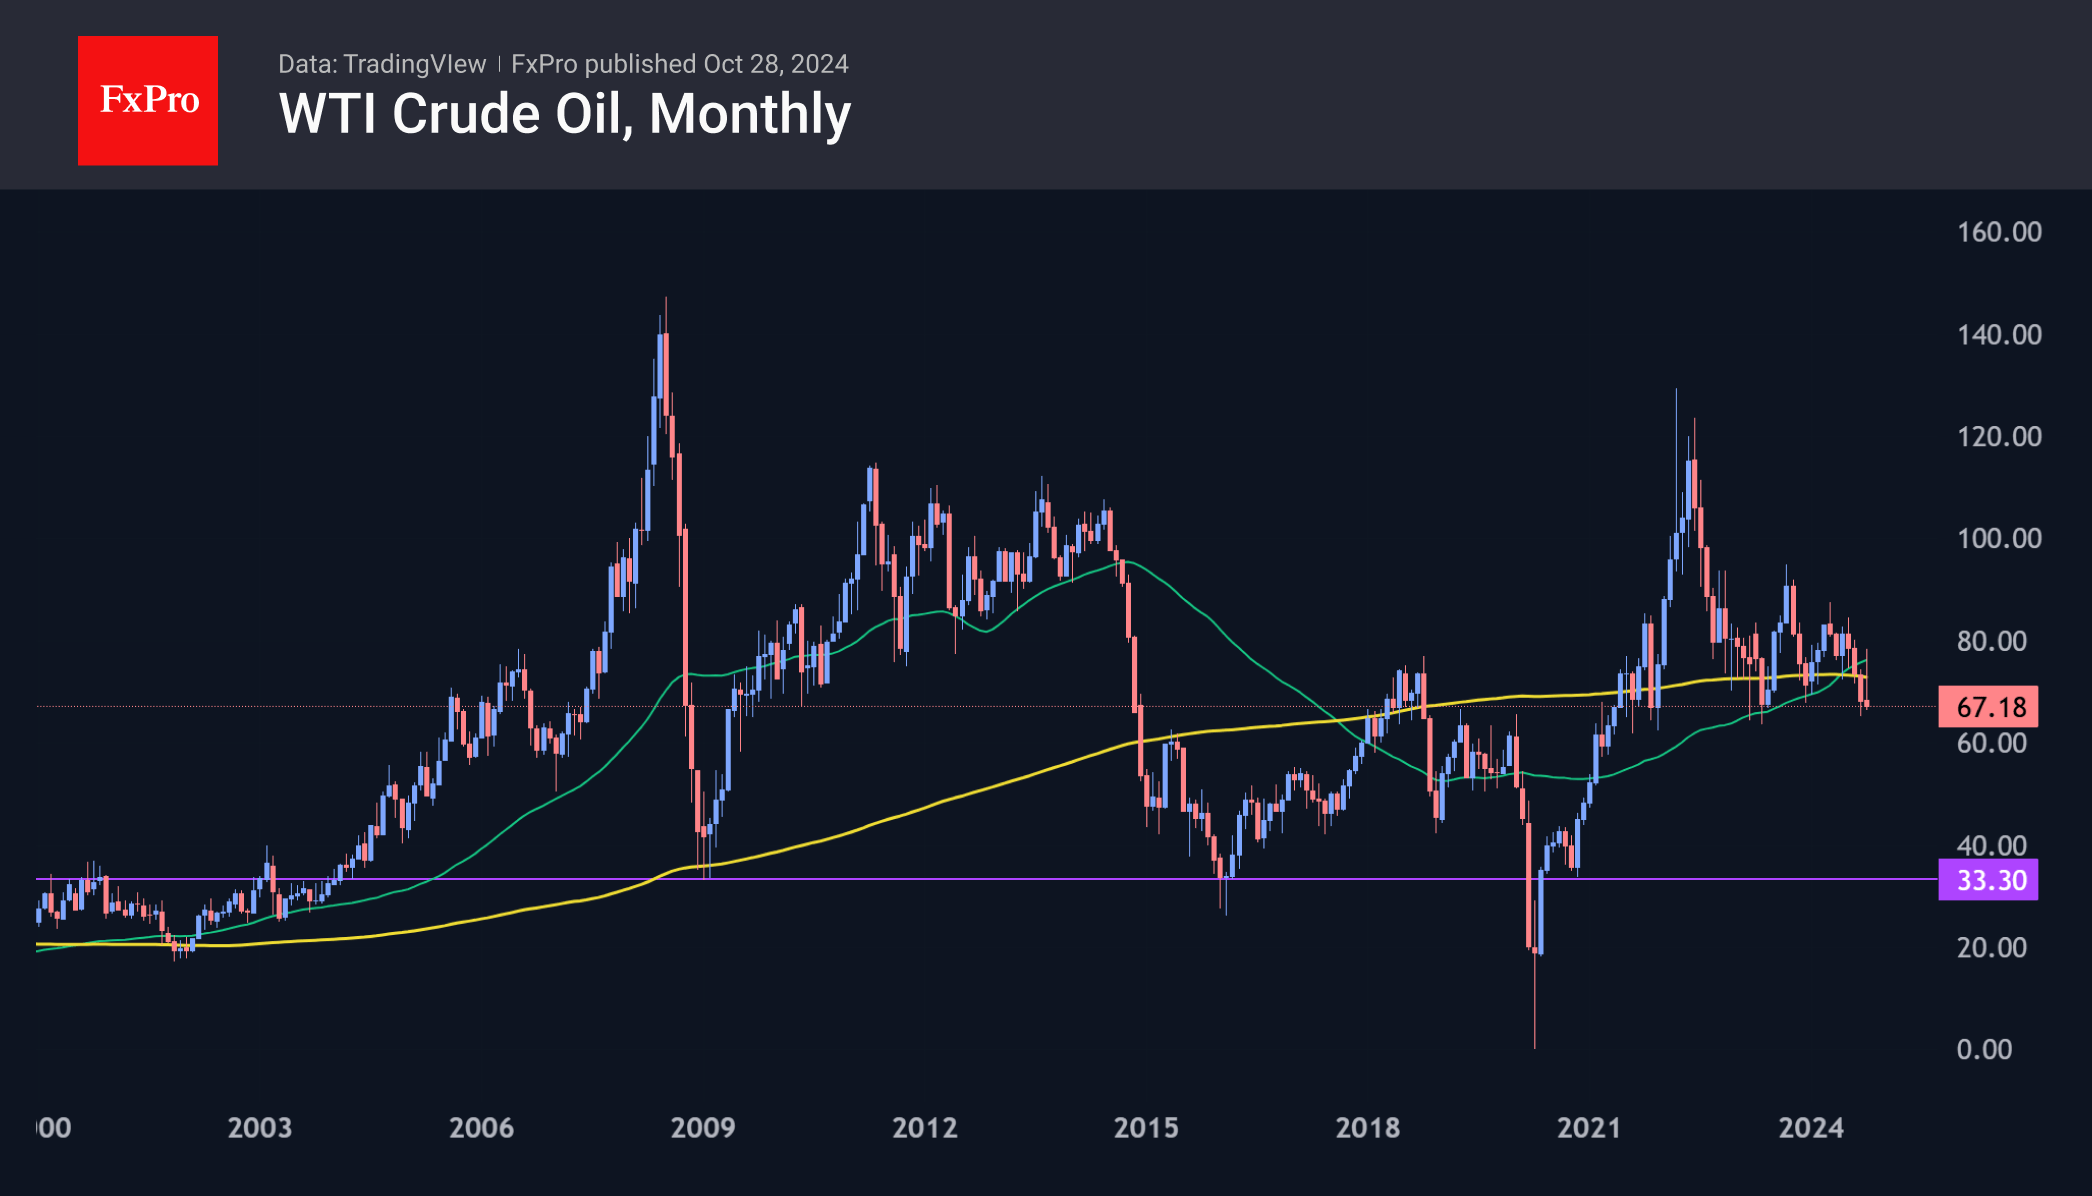
As the new week begins, the price is testing the horizontal support of the last two years. A close below $65 in October would be a major bearish signal that could accelerate oil’s decline. There is a risk of a dam bursting, with the next downside target being the $50 area, a psychologically important intermediate level. The history of the 2008-2009, 2014-2015, and 2020 collapses suggests that the final ‘bottom’ may not come until the $30-35 area.
The FxPro Analyst Team