Oil has risen in five of the last six trading sessions, gaining almost 4%. With a lower volatility, Crude may be preparing for a big move higher.

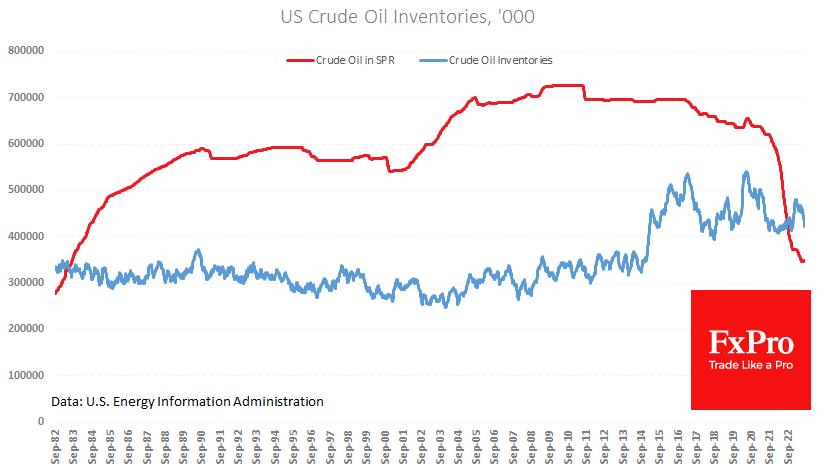
US commercial oil inventories plunged by 10.6M barrels last week and have fallen by almost 34M over the past five weeks. Inventories are now only 1.1% higher than the same week the previous year. This is despite the release of over 100M barrels, or 22%, of the US Strategic Petroleum Reserve during this period.
There is an oil shortage in the US market. Oil producers are trying to fill the gap by increasing production to 12.8 million BPD in August, up from 12.2 million a month and 12.1 million a year earlier.
But it is also clear that companies are in no hurry to invest in expanding production, as the number of active rigs has been falling almost every week since last November. Probably, this is the response to a sharp tightening of monetary conditions, pessimistic economic forecasts, and the US government’s attempts to suppress prices by selling off its strategic stockpile. Add to this the lukewarm attitude to investment in conventional hydrocarbons as part of an environmental agenda.
It is also likely that the ‘interest’ of oil producers waned as the price settled into a range consistently below $80, while several attempts to push the price back above met with solid resistance.
August could be an essential turning point for prices in this regard. This is undoubtedly the case on the WTI price chart.
Early last week, buyers supported oil immediately after falling below $78, the 61.8% Fibonacci retracement of the rally from the June lows (at $67) to the August highs (at $84). This correction has cleared the medium-term overbought condition, with the RSI on the daily chart moving back from over 70.
The reversal to the upside also coincided with the formation of a golden cross, where the 50-day moving average crosses the 200-day MA from below, impacting market sentiment.
The actions of OPEC+ to extend existing restrictions and the recent additional cuts are helping to create a bullish picture on the chart. These efforts have been fruitful so far, as Russia and Saudi Arabia have increased gross oil revenues despite lower production, as higher prices have offset lower sales volumes.
The FxPro Analyst Team