Oil has lost 1.7% since the start of the day on Tuesday, in addition to a more than 3% drop the day before, clearly showing the market’s reaction to the OPEC+ meeting over the weekend. The technical picture in oil has turned very bearish. OPEC+ agreed to an impressive extension of low production quotas, but markets are paying more attention to the short-term supply-demand balance and viewed the move as underwhelming.

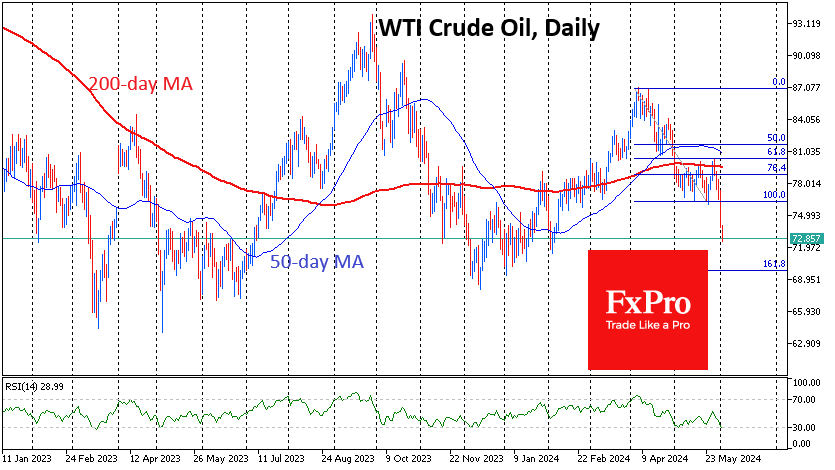
In the middle of last week, WTI crude bounced off resistance in the form of the 200-day moving average and moved closer towards the lower end of the May trading range. Oil is also trading below its 50-day average, which is pointing downwards. All of this is evidence of an intensifying bearish medium and long-term trend.
Earlier, we also pointed out that the cartel, especially Saudi Arabia and Russia, is becoming hawkish, preferring to give active signals or cut production when the price gets close to the 200-week average. This curve reflects ultra-long-term trends, averaging the price over almost four years. Oil has been receiving impressive support after touching this line in 2019 and 2023. Since the beginning of this year, there have been new attempts to break below, which have so far resulted in strong upside momentum.
It very much looks like that situation has now changed. Oil is already more than 3% below its 200-week average, having been under sustained pressure since the start of the week. In addition, the intensified daily selling of oil in US trading since last Wednesday has contributed to this.
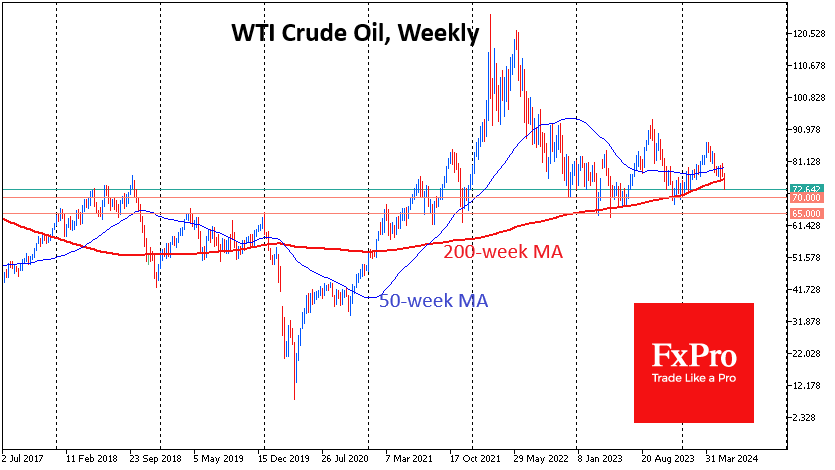
In 2020, the breakdown of this long-term support culminated in a hike in some oil contracts into negative territory. We saw just as much market drama in 2014 after a similar signal. It was perhaps only in 2018 that oil managed to turn to the upside, falling just 18% below its 200-week average.
Thus, we may be seeing the beginning of the formation of one of the significant downtrends in oil, capable of being on par with the 2014-2016 or 2020 sell-offs. In this case, the price may roll back to the $30 area—the price area where most oil production projects lose profitability.
However, the bulls still have a significant support area of around $65-$70 per barrel. This was the resistance area in 2019 and the support area in the last three years.
The FxPro Analyst Team