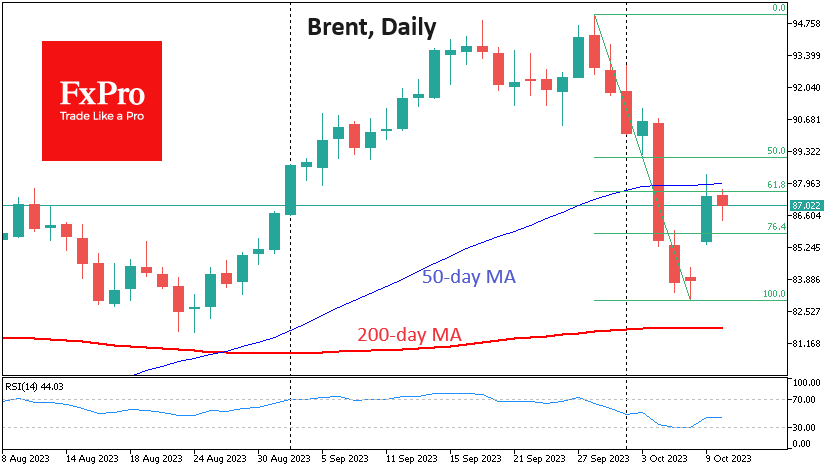
Oil’s bounce at the start of the week’s trading was an essential step in correcting the short-term oversold condition, but it may only fuel the interest of new sellers.

The oil price is down 12.8% in the six trading sessions since 28 September. A local low was recorded immediately after the release of the labour market data. However, interest in oil was soon fuelled by speculation that, along with a strong labour market in the US, there was no increase in inflationary pressure. On Monday, investors speculated about the risks of energy supply reduction due to the involvement of other Muslim countries in the conflict, which will put oil and gas supplies at risk.
But let’s look at the situation without emotion and speculation – purely from a tech analysis perspective. From this point of view, the latest bounce was a critical correction that could clear the way for a subsequent decline.
Brent oil turned downwards from $95 and quickly reached $83, falling sharply under the 50-day moving average. Last Wednesday’s dip signals that the bears are firmly in market control.
By Friday, the RSI on the daily charts began to flirt with the oversold area. Since the end of 2020, this signal has consistently triggered a reversal. The same thing happened this time around.
Thanks to the US data and the military conflict in the Gaza Strip on Monday, the price made a classic rebound to the 61.8% area from the initial decline. But its recovery stalled there. We also note that on Monday, the price tried to return above the 50-day average but closed the day lower.
There was no upward momentum in oil for most of the day on Tuesday despite the strengthening of stock indices, indicating a recovery in risk appetite.
If the bears keep an upper hand over the oil market, we could see a gap close at the start of the week’s trading in the next couple of days. The following support line in oil looks to be the 200-day moving average, now just below $82.
A more ambitious downside target is $75, where the most crucial separator of market cycles in the form of the 200-week average and the 161.8% level of the last downside impulse may cross by the end of the year.
The FxPro Analyst Team