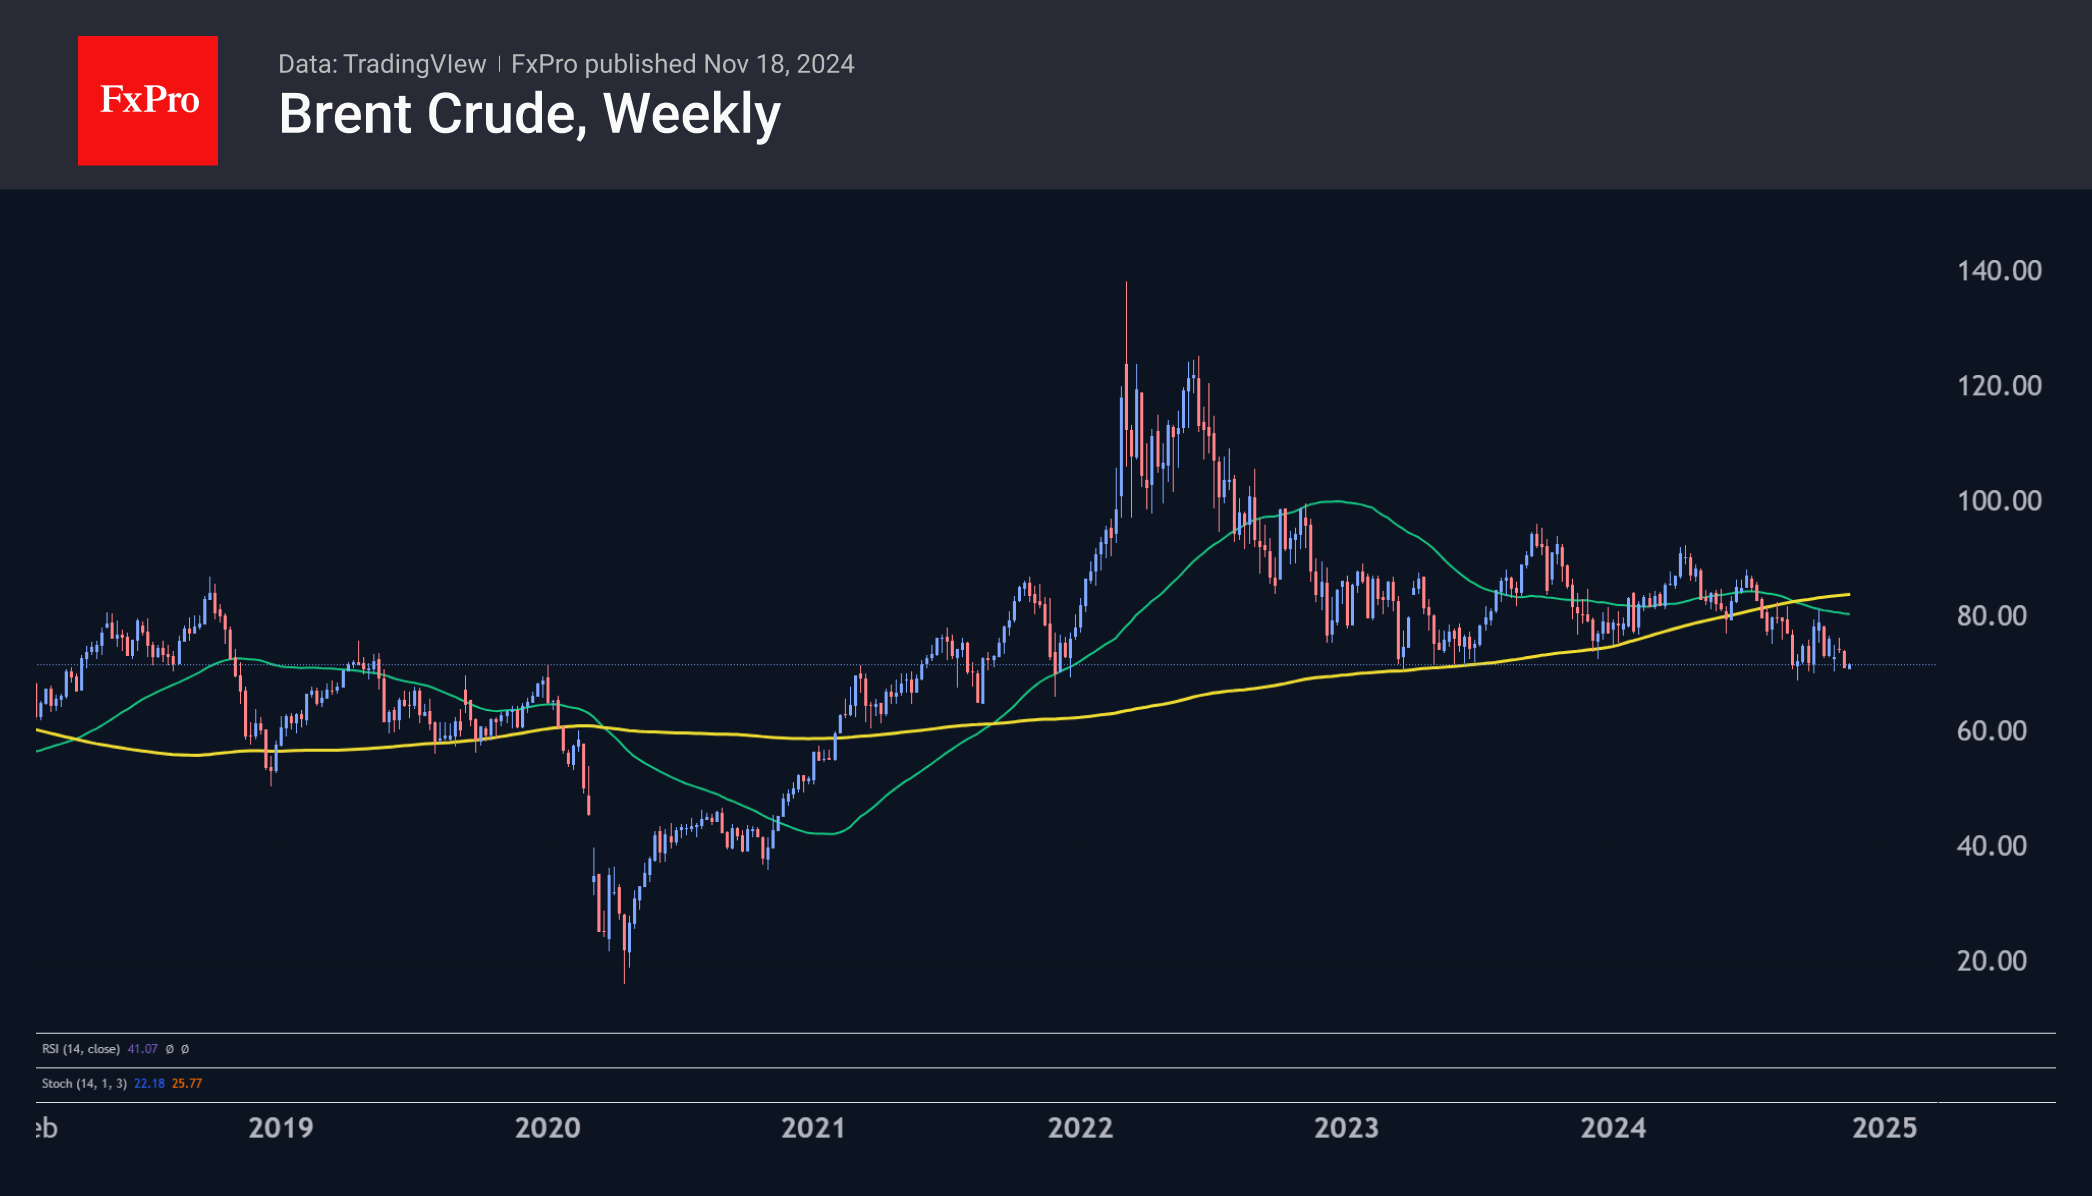
The oil market started the week at the lower end of the trading range for the last two months, coinciding with the lower end of the range for the last three years and the upper end for the price in 2019. This is noteworthy as both a sharp rebound and an ultimate failure are possible. Oil’s repeated return to this level in recent months reinforces the potential for a follow-through move if one side capitulates.

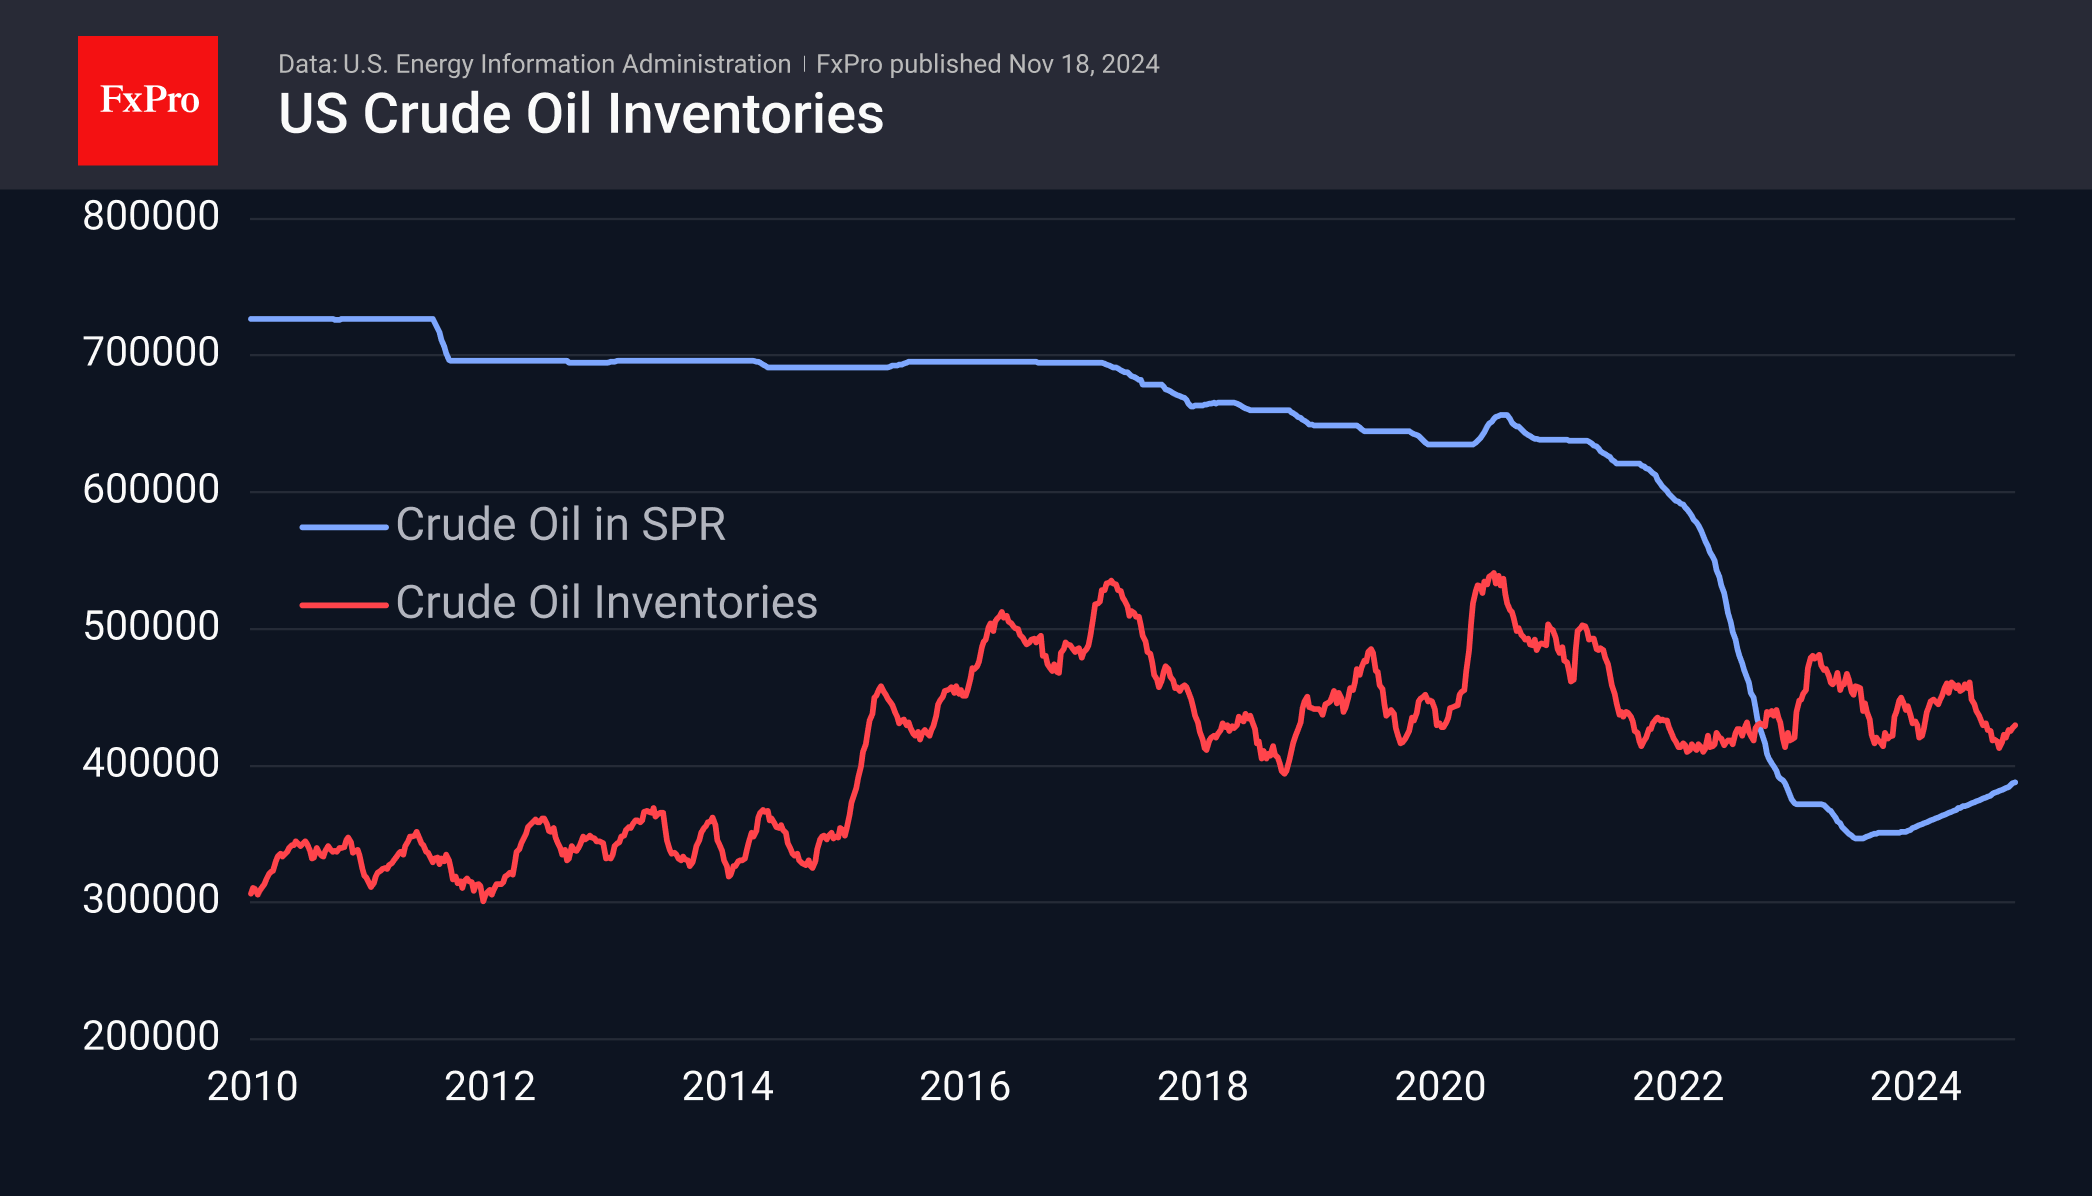
Last week, US commercial oil inventories rose by 2 million barrels, and the strategic reserve increased by 0.6 million barrels. This could have been a bearish factor, but seasonality is playing its part: commercial inventories are 2.2% lower than a year ago. In addition, production fell to 13.4mbpd from 13.5mbpd in the previous four weeks.
With Brent’s price approaching $70 a barrel, OPEC+ has repeatedly been forced to get creative by intervening on the supply side of the market. The price started the week at $70.60 and rose to $71.40 at the peak of European trading.
On the chart, the current consolidation levels are below last year’s lows, and the price remains well below its 50- and 200-week moving averages. This leads us to view the consolidation as a pause before a fresh sell-off. A break of this support could lead to a sharp decline towards $30-40, but oil producers could intervene, adding to the uncertainty.
Natural gas
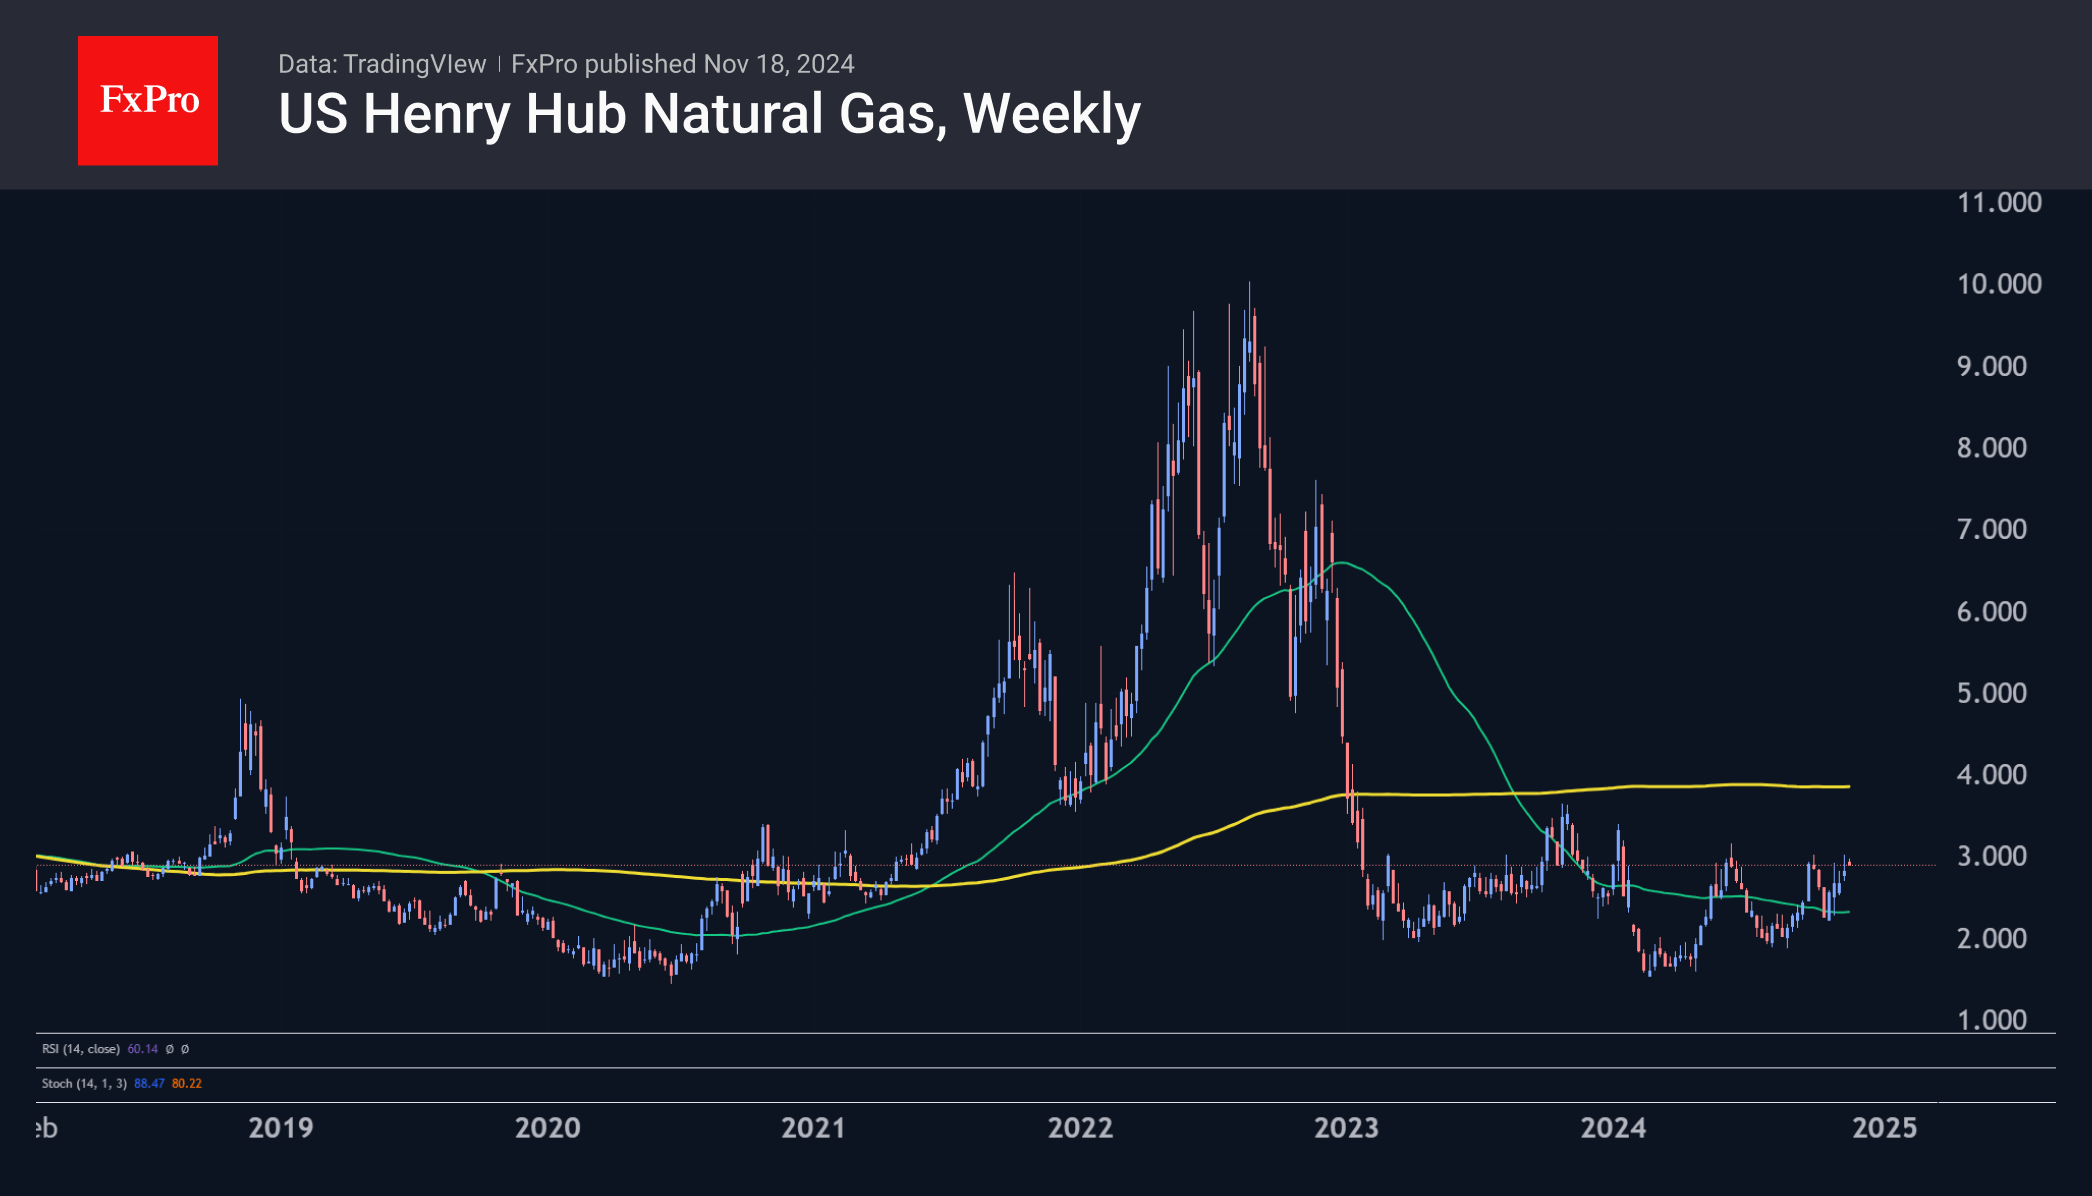
The dynamics of natural gas prices are also intriguing. The US natural gas spot price started the new week at $3.17. Four times this year, the price has reversed from rising to falling near this level. This time, however, there is no technical overbought condition on the chart. Just over a year ago, a break of $3.10 triggered a 20% rally to $3.7, but the advance was halted by the approach of the 200-week moving average (now at $3.90).
The FxPro Analyst Team