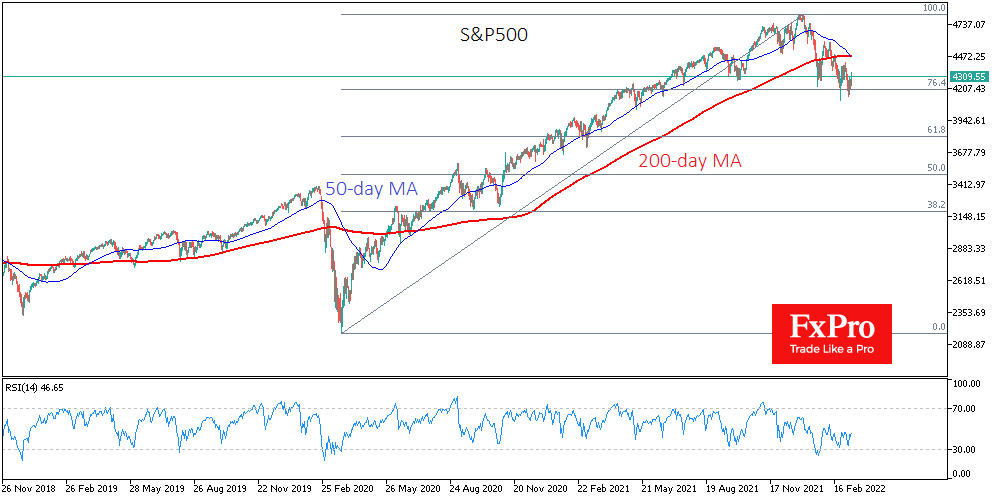
The US S&P500 closed Thursday with a 0.4% drop, but the sustained downward trend since the beginning of the year has formed a “death cross”, a bearish signal of Tech analysis when the 50-day Moving Average crosses down the 200-day one.

It is widely considered as a downtrend confirmation, followed by a further and faster market decline. However, this time the situation might be more optimistic, and there are several other indications, both from technical analysis and the news background.
The history of the past ten years makes us wary of any signal that follows from a crossover of these averages. The “death cross” was most clearly triggered in August 2015 and December 2018, when this signal was followed by 12% and 16% drawdowns in the index in the following couple of weeks. The difference between those episodes and the current one is that back then, the market was stalling for a long time, with no strength for growth.
This crossover has now taken place after a three-month correction. This trend brings the situation closer to 2020 when the market collapsed on the pandemic – the “black swan”. The war between Russia and Ukraine is the same black swan that accelerated and intensified the correction. In March 2020, and again almost two years later, the “cross” came after an impulsive decline and away from local lows.
On the daily timeframes, another indicator, the Relative Strength Index, shows a waning of the downward momentum, as the new lows of the S&P500 index met the RSI at higher local lows. The broad market index found solid support at 76.4% Fibonacci in March from the rally from the pandemic bottom to the peaks of January.
There are some fundamentally positive developments for the market. President Putin of Russia rather unexpectedly noted progress in the negotiations with Ukraine, while outside observers the day before stated the opposite. Also, Fed rhetoric has become much softer over the last month, and US lawmakers are more likely to agree on stimulus packages, supporting the demand for risky assets.
The FxPro Analyst Team