A zoomed out version of the bitcoin chart shows it would take the cryptocurrency another 365 days to achieve a full-fledged upside breakout. Brought to notice by Teddy Cleps, a prominent cryptocurrency analyst, the weekly Bitcoin chart shows the possibility of it forming a massive bullish pennant. In retrospective, a Pennant structure marks a pause in the price movement of an asset midway, followed by a strong breakout in the direction of the trend. However, if the formation lasts longer than four weeks, traders often start treating the Pennant as a symmetrical triangle.
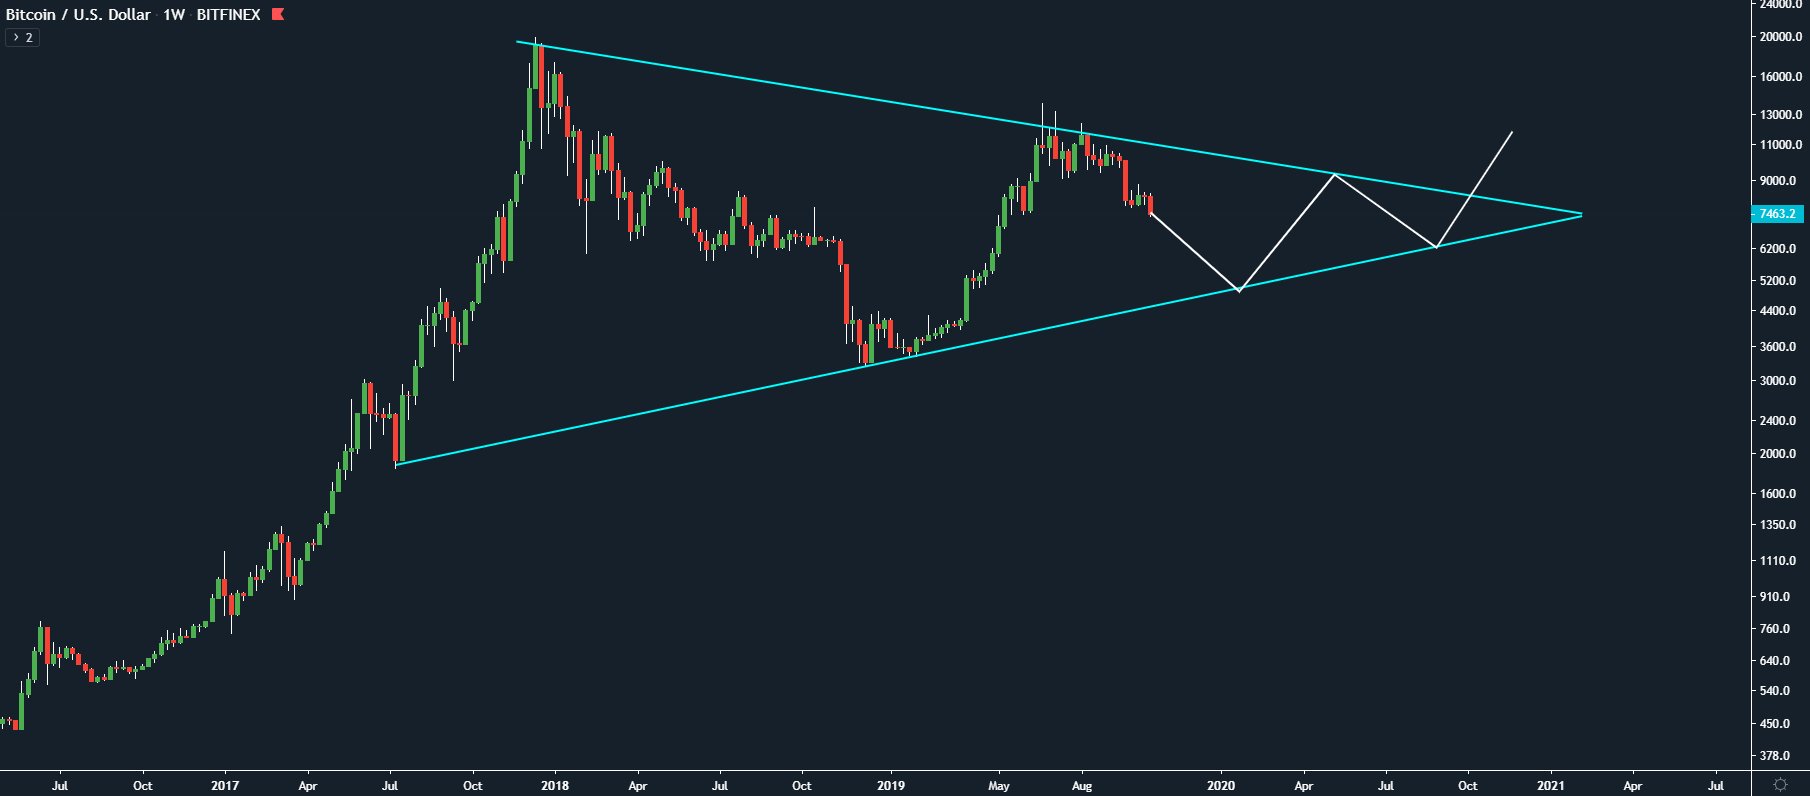

Unlike Pennant, a Symmetric Triangle formation could give either of the two scenarios: a breakout or a breakdown. In the case of the latter, the price moves in the downside direction, with target equivalent to the height of the triangle. Should such a scenario takes place, bitcoin will fall to as low as $1,000. “What if the last run to 14k was just a lower high,” said Cleps. “If a massive pennant similar to the chart were to play out – it would take more or less 350+ days for a breakout/bull run.”
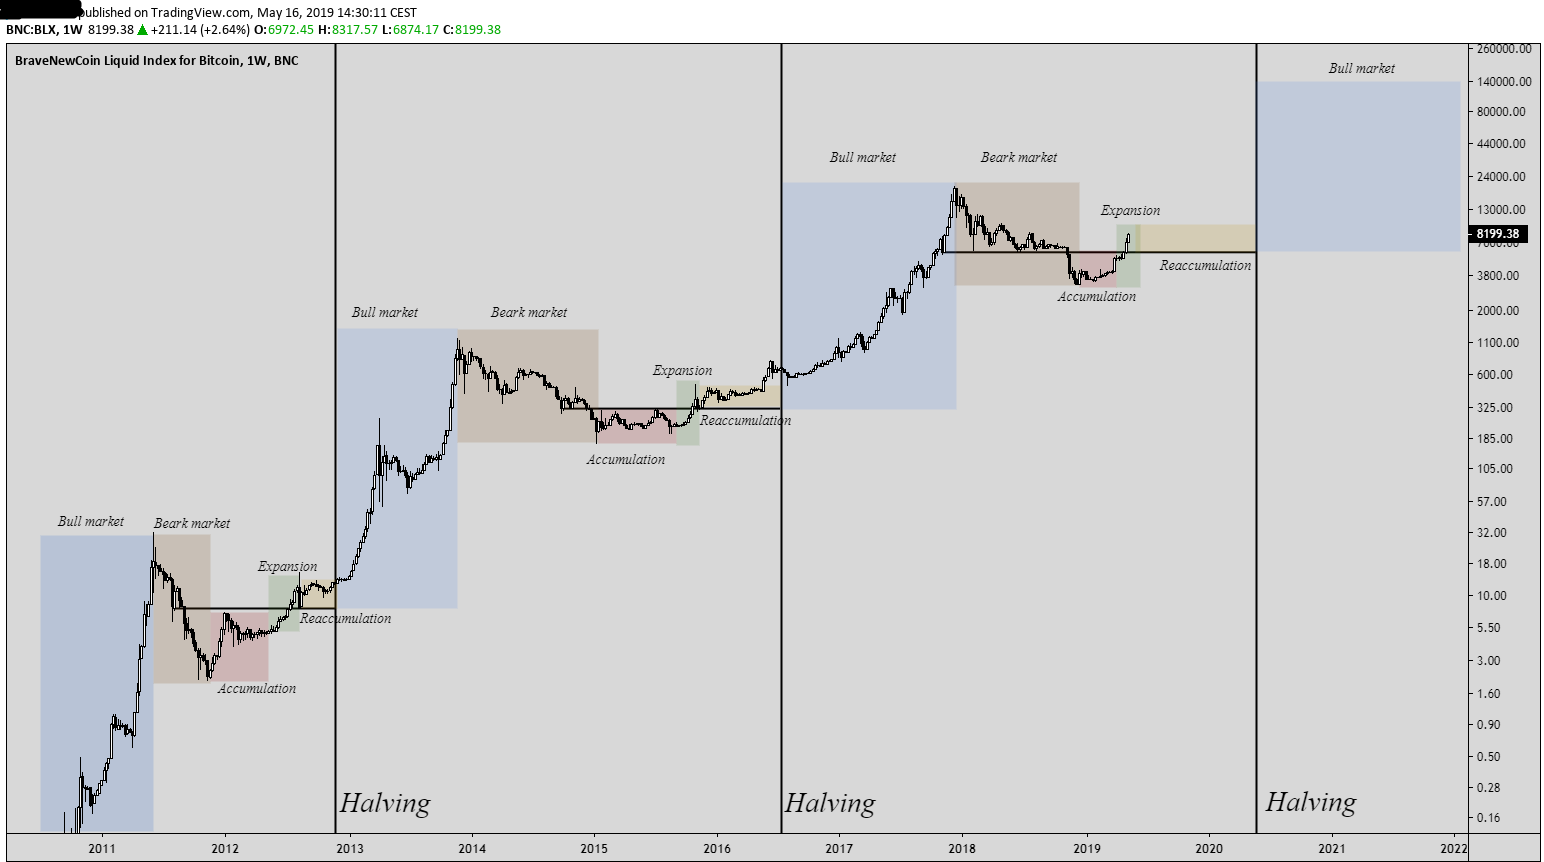

The biggest takeaway from Cleps’ pennant theory is the date of bitcoin’s next halving – an event that reduces the cryptocurrency’s supply rate by half. Bitcoin supporters think an additional scarcity would make the cryptocurrency more expensive based on its history following each halving date. The halving theory somewhat conflicts with that of Cleps. Ideally, the bitcoin price should surge exponentially after the next supply cut. Nevertheless, Cleps’ chat shows bitcoin swinging lower around May, the month in which the halving will take place. The analysts further belives that traders have already priced in the halving sentiment during bitcoin’s stupendous bull run this year. He tweeted: “I believe its already priced in – me, you and my grandma is aware of the halving! Unlike the previous one.”