Crude oil reversed sharply last Friday after rallying almost 15% from the lows at the end of last month. The short-term decline so far fits into a technical correction after the rally. However, looking at the broader trend, this reversal aligns with the year-long price action, with a turnaround from the upper boundary of the descending corridor.

To recap, the oil price has been pushed up since late last month by several factors, from Russia’s export cuts, the extension of Saudi Arabia’s production cuts and plans to start replenishing the US Strategic Petroleum Reserve to risk-on appetite, as well as a decline in the dollar following US jobs market and inflation data. And only one loud factor on the bears’ side – economic woes. It still needs to be determined whether we are facing a fall in demand or just a slower demand growth.
The technical picture is surprisingly picturesque. WTI crude oil turned sharply lower immediately after touching the 200-day moving average. There were a few days of resistance in early April, but now oil seems to have given up in one fell swoop. At the same time, the reversal occurred immediately after an attempt to break the upper boundary of the descending channel that has been in place since last July.

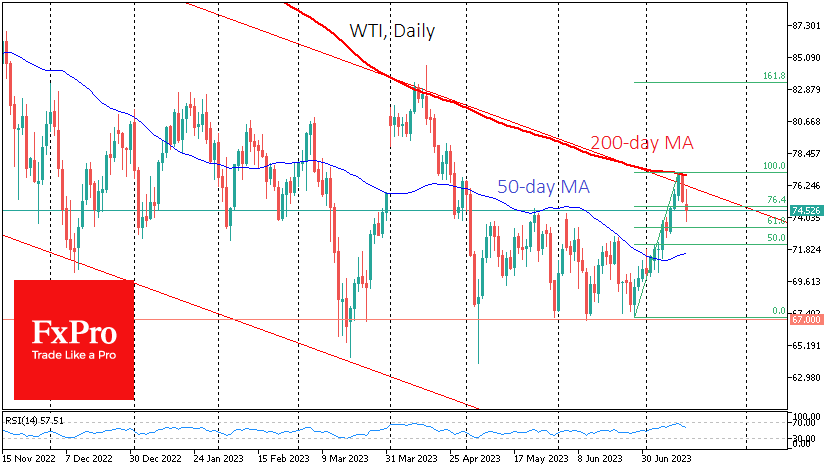
The lower boundary of this trend is now around $55, but it may take months to reach the lower boundary, and oil may encounter several significant support levels along the way.
First, the bears need to prove to the market that we are seeing more than a correction after the rally on Friday and Monday. In this case, the signal level is $73.3, where 61.8% of the rally has taken place.
The 50-day moving average, which acts as a medium-term trend indicator, may also be a potential support level. The break above it at the beginning of the month contributed to the interest in buying black gold.
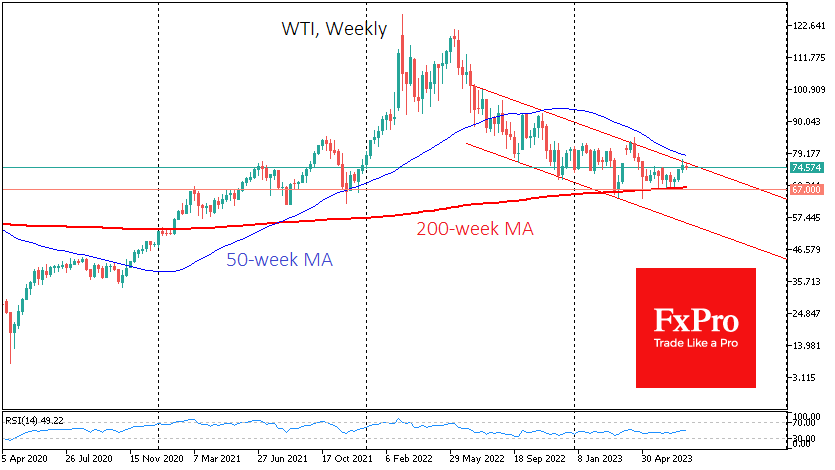
On the downside, oil will need to break through the main support level of recent months – the 67 levels. OPEC+ has been carefully guarding this line since March of this year, repeatedly announcing supply reduction measures near this line. Technically, the 200-week moving average, an indicator of significant cycles in oil, is close to this level. A break below it could open the gates to a long liquidation in oil comparable to that of 2020 or 2014.
The FxPro Analyst Team