Categories: Market Overview

Natural gas Wave Analysis – 20 January, 2022

• Natural gas reversed from resistance area

• Likely to fall to support level 3.525

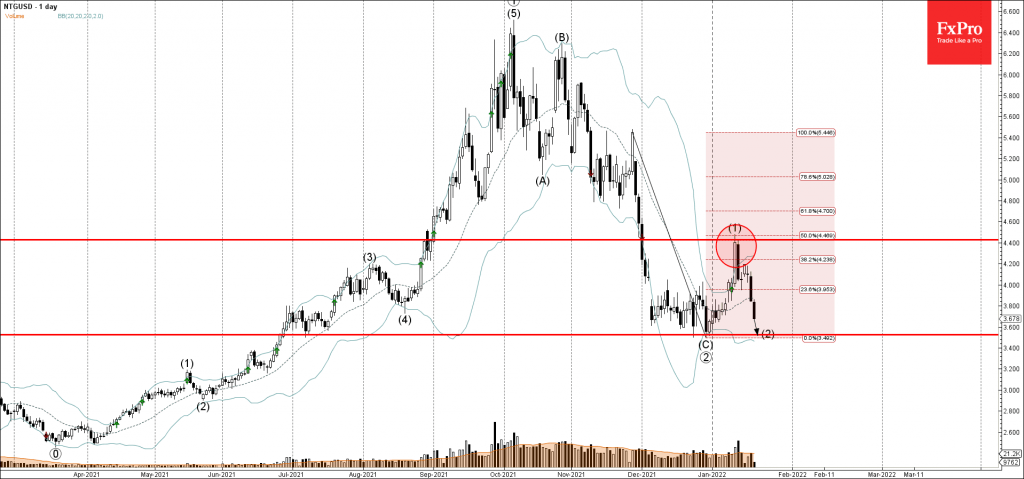
Natural gas recently reversed down from the resistance area set between the resistance level 4.4, upper daily Bollinger Band and the 50% Fibonacci correction of the downward price impulse from November.

The downward reversal from the resistance level 4.4 started the active intermediate corrective wave (2).

Natural gas can be expected to fall further toward the next support level 3.525 (previous monthly low from December and the target for the completion of the active wave (2)).

The FxPro Tech Analysis Team

The FxPro technical experts prepare a daily analysis of the most active currency pairs (majors, crosses, exotics) and commodities. Selected instruments are reviewed on daily trends (D1, H4), using the active Elliott Wave setups, Japanese candlesticks, indicators, and support/resistance levels.

Share
Published by
The FxPro Tech Analysis Team
Tags: natural Gas

Recent Posts

Central banks did not scare the dollar

•    Central banks prefer to pause. •   The strengthening of the dollar prevented gold from…

3 hours ago

The crypto market is updating its lows but avoiding sharp changes

The crypto market remains volatile; Bitcoin and altcoins fluctuate amid investor caution, ETF activity, and…

4 hours ago

JPMorgan Chase Wave Analysis – 18 December 2025

JPMorgan Chase: ⬇️ Sell - JPMorgan Chase reversed from resistance area - Likely to fall…

15 hours ago

EURUSD Wave Analysis – 18 December 2025

EURUSD: ⬇️ Sell - EURUSD reversed from resistance area - Likely to fall to support level…

15 hours ago

AUDJPY Wave Analysis – 18 December 2025

AUDJPY: ⬆️ Buy - AUDJPY reversed from support area - Likely to rise to resistance…

16 hours ago

Palladium Wave Analysis – 18 December 2025

Palladium: ⬆️ Buy - Palladium broke multi-month resistance level 1600.00 - Likely to rise to resistance…

16 hours ago

This website uses cookies