The major US indices are under pressure amid the ongoing reassessment of the Fed’s monetary policy outlook. The S&P500 and Nasdaq100 indices are testing key technical support again, returning to the crossroads they left over a month ago.

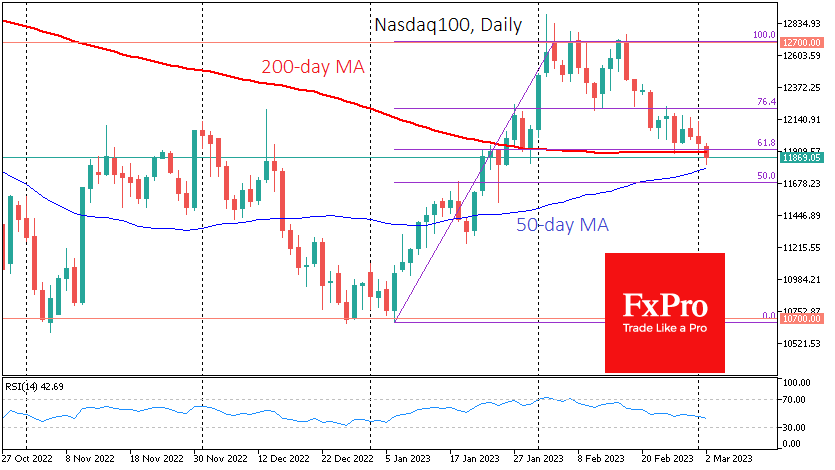
Nasdaq100 futures fell to 11850 this morning, a more than one-month low, giving the bears back half of the gains from the lows in early January to the peak a month ago. More remarkably, the index has been testing support at the 200-day moving average since Wednesday evening and is below it at the time of writing.
Today’s drop is below the 61.8% retracement level of the January rally from 10700 to 12700. This means that the market’s momentum today and tomorrow could be the index’s decisive momentum.
This morning’s decline has stopped at a distance from the 50-day moving average, which often acts as a trend indicator. A consolidation below these two critical curves would signal that the market is ready to move lower.
In that case, January’s rally would fit into a typical corrective pullback from the global highs of November 2021 to the lows of October 2022. A return to 10700 is a matter of “when”, not “if”.
However, the outlook for the market is by no means a foregone conclusion. There is still a chance that the 50-day moving average will hold and the 200-day moving average, the so-called “golden cross”, will be broken in the first half of March. That will be a bullish signal for a wide range of players and doubly true if the price is above that cross.
Also bullish is the fact that the RSI on the daily chart is out of the overbought zone. In other words, the correction that was called for in early January is already complete.
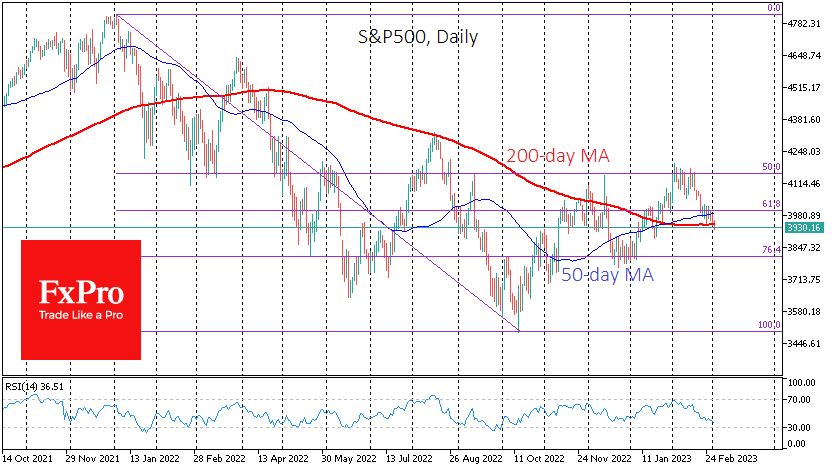
The S&P 500 Index slipped below its 50-day MA and under 4000 a week ago and is now testing its 200-day MA. Consolidation below 3900 could be the prologue to an extended, month-long decline with potential targets near 3800 (December support) or 3700 (200-week average).
Alternatively (less likely), a return to growth from current levels would consolidate a bullish global reversal in the US equity market and take the S&P500 to 4200 before the end of March.
The FxPro Analyst Team