By the end of the week, the stock markets returned to a cautious mood, as players’ attention shifted to the problems of the production sector. Asian trading bourses declined for the second day in response to the Hubei Province’s call for companies not to return to work until March 11 and all new reports of the suspension of factories around the world due to lack of components from China.
Preliminary estimates of manufacturing PMI indexes are set to release on Friday, which may bring back the focus on business sentiments. The Japan Manufacturing PMI released this morning caused markets disappointment and made them look cautiously at the European data that will be released later today.
Besides, the stock markets seem vulnerable to corrective pullbacks at current very high levels. The increased caution of investors is easy to understand.
Market prices already reflect monetary stimulus and expectations of declared easing. However, new evidence is emerging almost daily on how the transport blockade in China is affecting businesses around the world. Traditional monetary incentives in the form of rate cuts can hardly be called the cure in this case.
Interest rate cuts have proven to be effective in times of overproduction, and demand shocks, when businesses afraid to spend, assuming a drop in sales. Now the companies are often unable to do so due to logistics breakdown. Under these conditions, the main driver of growth in stock prices may be only buybacks of companies. Earlier this week Apple warned that it would not fit into its range of profit forecasts for the first quarter. It should be expected that many companies in the coming days and weeks will follow its example by revising their estimates.
Worst of all, the fundamental valuations point to a large overbought U.S. stock market based on earnings per share or price-to-sales ratios. By these measures, the market is similar to the situation in the late 1990s. The most dangerous in this case is that after five years of rapid growth stocks were sinking in the next 2-3 years. As a result of this correction, stocks returned closer to multi-year average levels and even below for mentioned multiplicators.
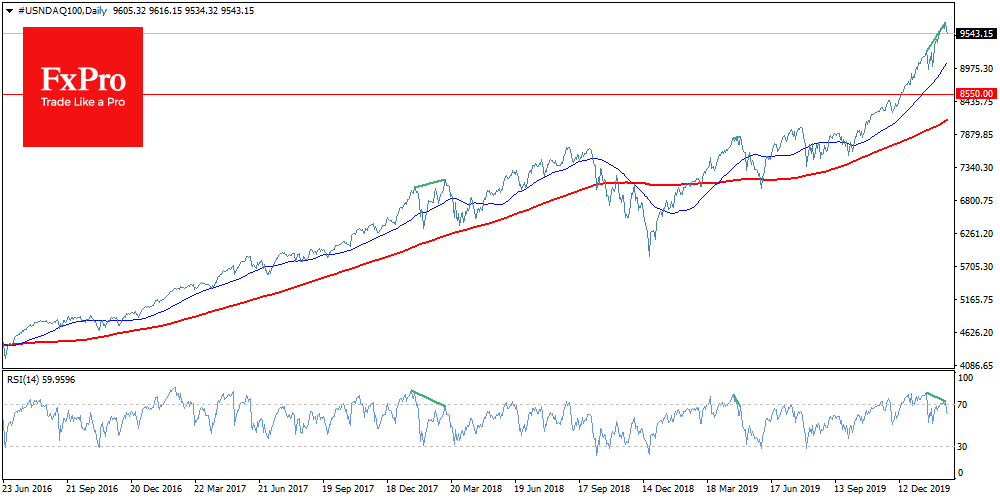
In the shorter-term, we also receive an alarm sign from the technical analysis. The Nasdaq index moved 2.2% away from Thursday’s peak levels, down to 9540. The RSI index on the daily chart declined from the overbought area, signalling the beginning of a correction rollback. At the same time, the divergence of RSI and the price chart for the last month can be seen on the chart, which may be regarded as a harbinger of a long decline. Last time, in May 2019, such divergence ended with a 12% decline in Nasdaq, which took almost a month. A similar situation in terms of signs and depth of deterioration was also observed in March 2018.
Repetition of the correction on the same scale, as we saw in previous years under similar circumstances, will send Nasdaq to the area of 8500 – to the levels of mid-December last year. It is difficult to classify it as a market disaster, but it is unlikely to be welcomed by those who bought stocks near the peak.
The FxPro Analyst Team