The Nasdaq 100 and S&P 500 indices, most closely followed by retail investors and traders, have faced some downward pressure since early August, but the latter still has a chance of maintaining an uptrend.

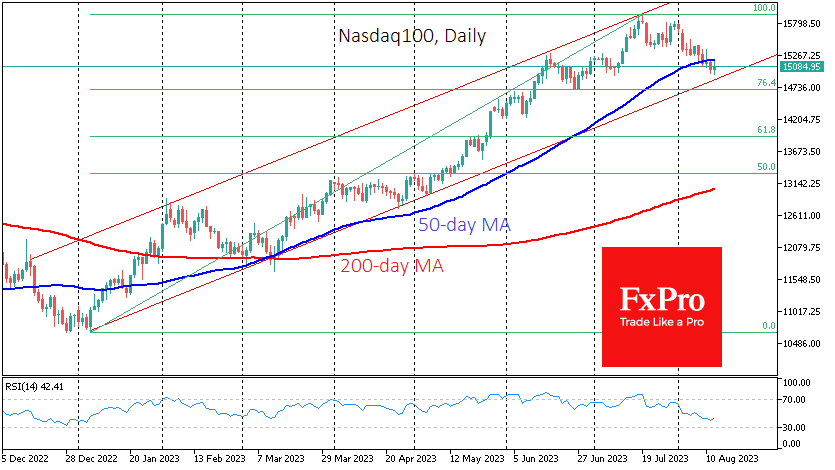
The Nasdaq ended last week with a 0.7% loss on Friday, a 1.9% loss for the whole week and a nearly 5% loss since the beginning of the month. Moreover, there was no significant rebound on Friday. This suggests that the tech behemoths are undergoing some profit-taking that began in early August after the impressive rally since the start of the year.
Another important factor for the medium-term trend is that the Nasdaq100 broke below its 50-day moving average (MA) after several days of trying to bounce back from that line. By contrast, in March, along with the 200-day, the same line acted as strong support, followed by a rally of more than a third of the entire Nasdaq100.
Considering this point as the rally’s start, a full correction could take the index back to 14400 before buyers regain market control.
However, it might be more reasonable to start from the lows at the beginning of the year near 10700, which was the third failed attempt by the sellers to break below the July high of 15798. In this case, the Nasdaq100 could decline to 13900, retracing 61.8% of the initial rally. A deeper sell-off target and reliable support could be the 200-day MA, now below 13000 but rising, which would be near 13300 by the end of the month, giving up 50% of the initial rally.
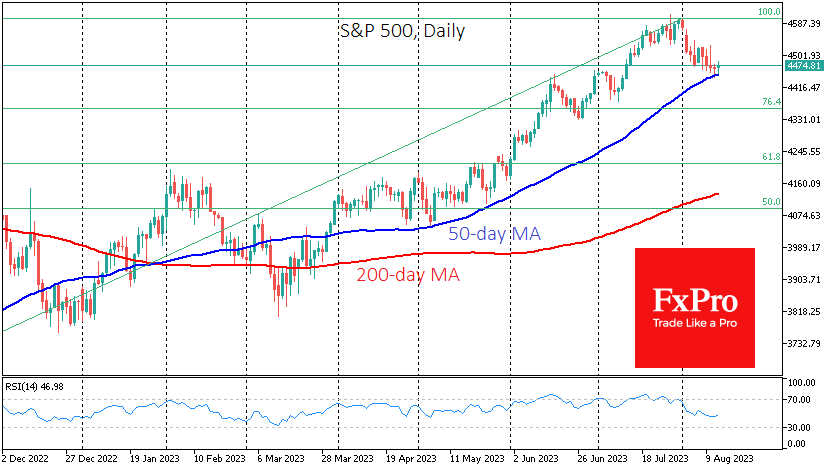
Meanwhile, the broader market represented by the S&P 500 Index remains above its 50-day MA, finding support on Friday on the drop to that line. The ability to stay above 4450 in the coming days could boost buyers and halt the profit-taking that has started in the US stock markets. A break below opens a technical target for a correction all the way to 4210, 6% below the current level.
The FxPro Analyst Team