The US stock market is attempting to bounce back on Friday after the heavy sell-off on Wednesday and Thursday. The Nasdaq-100 index was close to key levels where it reversed gains made in June and August. The S&P 500 has fallen below similar support, which is worrying.

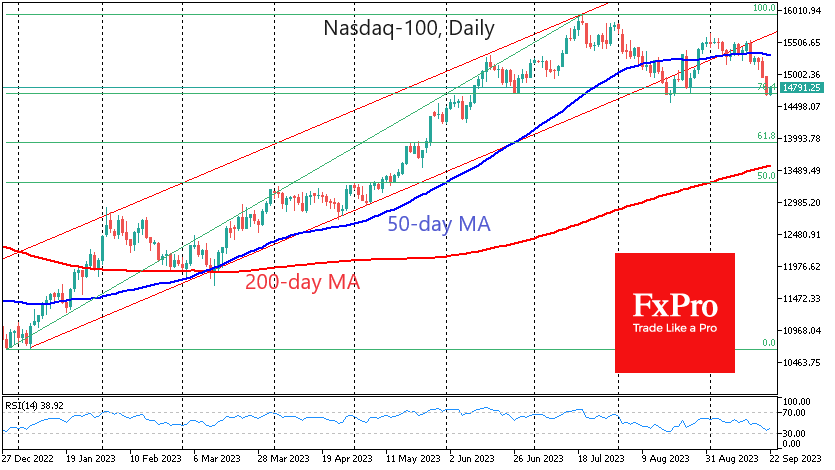
Nasdaq-100 futures fell below 14700 on Friday morning. Previously, on 26 June and 18 August, this area supported a reversal to the upside. But in that time, the situation has deteriorated. In June, there was a brief pause on the way up. It was a desperate attempt in August to hold onto the uptrend, followed by a long battle for the 50-day moving average.
The bearish team showed its strength in the second half of September when it first pushed the index below this medium-term trend indicator in a strong move and then pushed the Nasdaq-100 4% away from this line after the Fed meeting. In addition, the 50-day moving average reversed to the downside for the first time since early January.
As is often the case on Friday, we will see some short-term profit-taking that may raise false hopes. A consolidation below 14700 early next week will set the stage for a deeper correction. Potential targets are 13930, where 61.8% of the rally since the beginning of the year has taken place. Or the 200-day average, now near 13600 but pointing higher, will reach 13900 around mid-October.
The alternative scenario suggests that stocks will continue to find support not only on Friday but into the new week, forming a triple bottom and potentially completing a corrective pullback to 76.4% of the year-to-date rally.
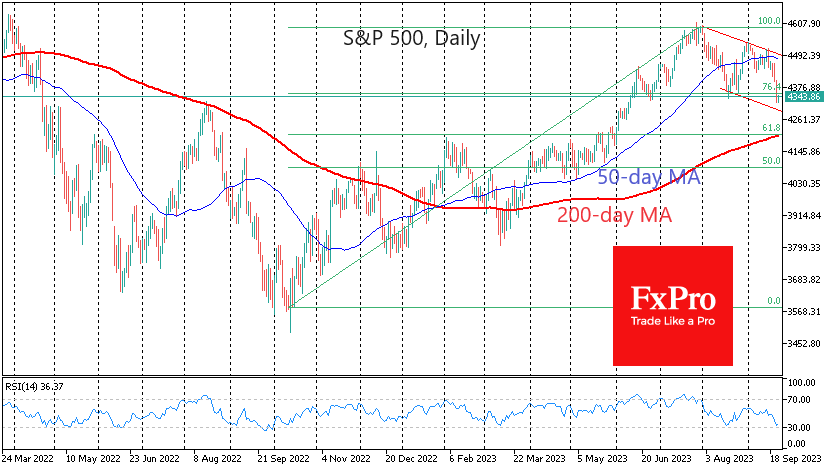
The S&P 500 is in a more difficult position, as Thursday’s trading saw the index close below the pivot points from August and the second half of June and below the 76.4% line of all gains since last October. A classic 61.8% Fibonacci retracement of the previous 12 months’ rally would suggest a decline to the 4200 area, the 200-day moving average and a former major resistance area from May 2022 to June 2023.
Even if these correction targets for the Nasdaq-100 and S&P 500 are fully met, we will still be in a bull market. At the same time, there is a chance that the monetary authorities will be more cautious in their comments on the economy’s strength, as they often judge it by the volatility of the markets.
The FxPro Analyst Team