Hang Seng lost 2.2% this morning, while the FTSE China A50 sank 3.3%. China’s economy showed higher growth than expected in the second quarter, but it failed to bring optimism to the markets. Pessimism around China is pushing down the indices of other countries: futures on S&P 500 lost 0.5% ahead of the European session.
The recovery in consumer demand is significantly behind, which casts doubt on the sustainability of the recovery. China’s GDP jumped by 11.5% QoQ against expectations of 9.6%.

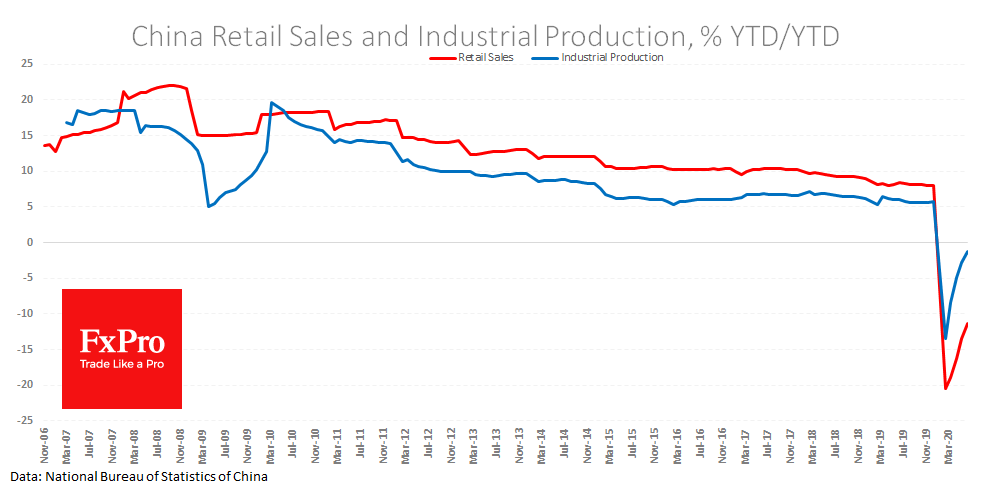
Monthly manufacturing output data showed an increase of 4.8% YoY and a decline of only 1.3% YTD. The manufacturing sector recovering rapidly, as government stimulus was focused on helping this sector.
The retail sales show quite a different picture. The indicator remains 1.8% below last year’s levels, losing 11.4% YTD. Local consumers have not yet become a driver of economic growth. This fact is alarming, as it imposes significant limitations on the potential economic recovery.
China’s economy remains highly dependent on exports, which is bad news, as demand in other countries remains weak. Also, the weakness of retail sales in China acts as a leading indicator for other countries who a couple of months later took the biggest economic blow from the coronavirus. After disappointment around Chinese retailers, markets are now even more cautiously waiting for the U.S. retail sales report release today, where sales are expected to increase by 5% MoM after a 17.7% jump a month earlier.
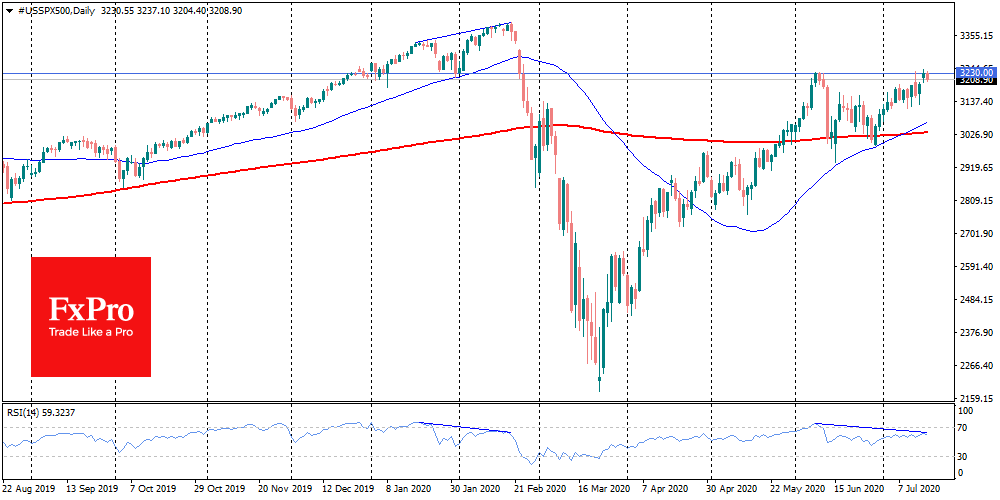
The increased market anxiety is reflected in a moderate demand for dollars. The dollar index rebounded from 4-month lows, and EURUSD fell under 1.14000. GBPUSD failed another attempt to reach above 1.2650, staying under pressure this morning, despite the stronger than expected labour market statistics. As for the S&P 500, technical analysis fans are watching the formation of the double top. The index reverses from the levels of 3230, as it did in early June, having obvious difficulties with entering the positive territory for this year. The RSI index forms a divergence with the price chart, showing a lower peak, despite the price returning to its previous levels. This often precedes a sell-off, as was the case in February.
The FxPro Analyst Team