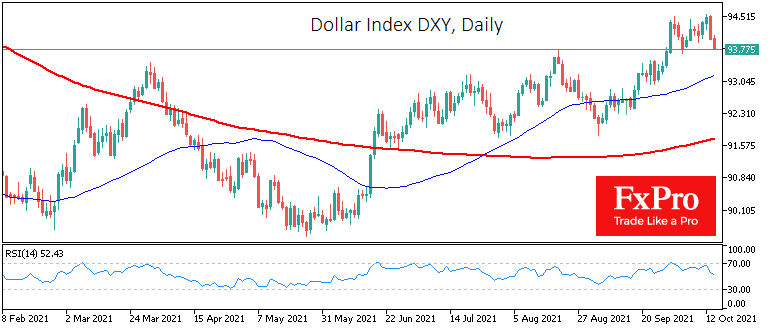
The dollar pulled back from a one-year high area, with US stock markets closing higher on Wednesday and its futures adding in trading in Asia. This performance was a market reaction to inflation data and FOMC meeting minutes. The market was near extremes in several major instruments and indices.

First and foremost, traders should pay attention to the dynamics of the US debt market. Minutes from the September FOMC meeting indicate that tapering could start as early as mid-November, and a rate hike by the end of 2022 is already completely priced into the Fed Funds Rate Futures market. At the same time, two- to three-year bond yields decreased, indicating that policy tightening would start quickly, but after that will be slower than previously expected.
This revaluation wasn’t good news for the dollar, causing the DXY to retreat from 94.6 to 94.0. There is a potential for a further correction with price and RSI divergence and the latter retreating from the overbought area above 70 on the daily charts.
EURUSD is also undergoing a critical test of the latest trend. The daily jump of 0.6% to 1.1600 lifted the pair above the downward resistance line, in force since early September. A consolidation above 1.1600 today would be the first signal to break the upside trend of the dollar, and a rise above 1.1640 promises to be a confirmation signal.
We should point out that this jump in EURUSD is not a strength of the Euro against its peers. It remains near cyclical lows against the pound at 0.8475 in EURGBP and has broken the floor at 1.07 in EURCHF, melting to lows last seen in November.
The S&P500 is also testing its downside resistance. Futures have been trading above it since morning, but we should wait for the reaction of the US market. Better yet, a consolidation above the area of the prior local highs near 4400.
Gold made an almost 2% jump on Wednesday, approaching $1800, the 200-day moving average. A meaningful sign of a bearish trend reversal in gold would be a consolidation above $1800 and confirmation to overcome previous local highs at $1836.
The FxPro Analyst Team