US Treasury nominee Jeannette Yellen called on Congress to “act big” to help the world’s biggest economy overcome the effects of the pandemic slump. Her comments, although expected by most participants, are still having a positive effect on markets on Wednesday morning.
Plenty of government spending in the US and other developed countries caused stock markets and Gold to rally earlier in 2020. It is worth expecting that a continuation of this course will allow markets to remain in line with previous trends.

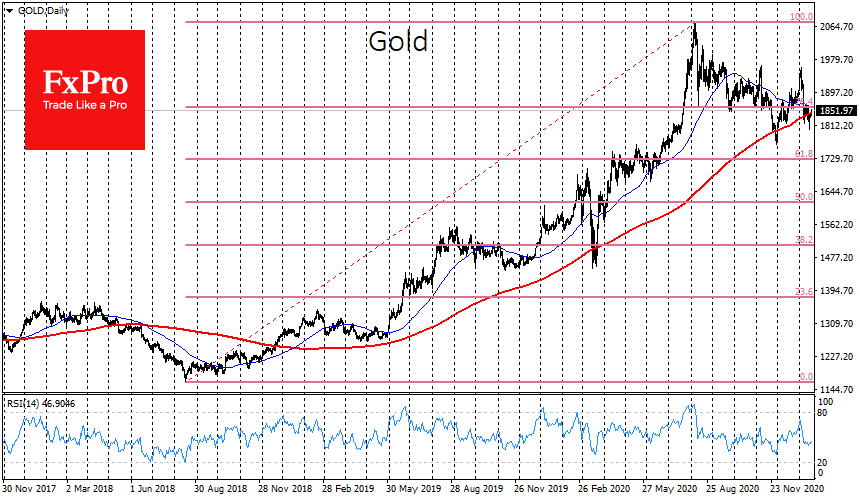
Gold clearly lost its upside momentum towards the end of the year, temporarily falling below its 200-day average at the end of November and hovering around this line for the last two weeks. This level has habitually acted as support for the uptrend during the last more than two years.
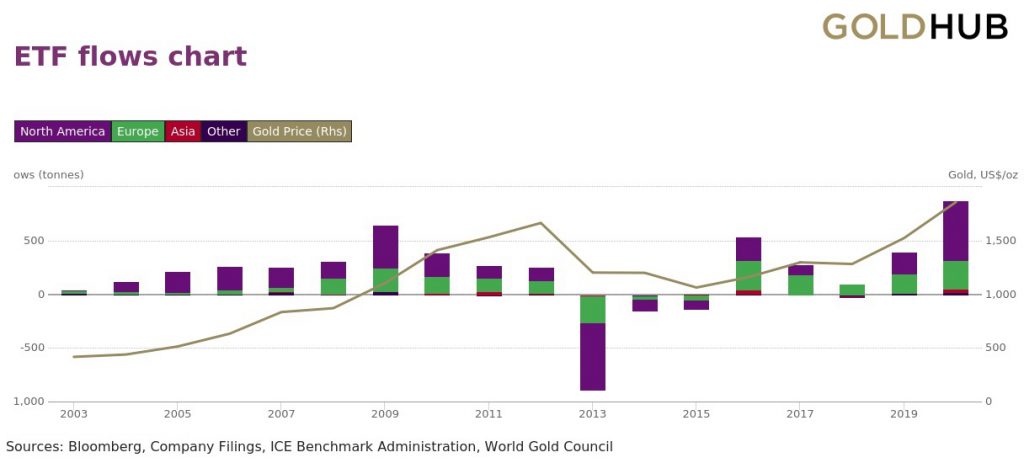
The gold ETF report released the other day showed record inflows in 2020, beating the previous record of 2009. However, it is worth considering that some investors are realising their interest in insuring capital against inflation in cryptocurrencies, while others are content to buy growth stocks in the expectation of strong positions in these companies in the years ahead.

Meanwhile, Gold has been stuck in a downward sideways slide since August. The recovery of the markets’ optimism this week brought the price back above $1850/oz, and the 200-day MA appears as support again. However, it is not able to split away from it.
The short-term trend indicator in the form of the 50-day average is now passing through $1855 and it will dip under the 200-day average in the next few days. If the price goes below those levels, it will be a strong bearish signal, called the “death cross”.
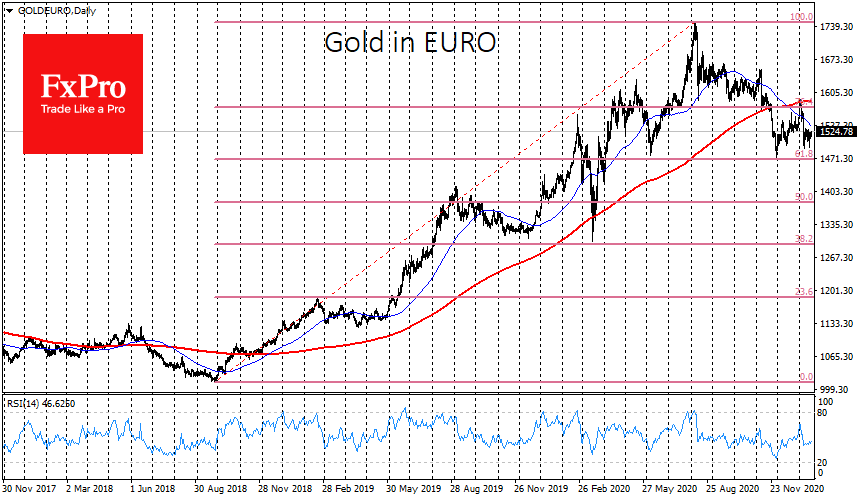
The situation is even more alarming on the GoldEuro charts. There the price fell below the 200 SMA at the end of November and at the same time it retreated 23.6% below the correction line from the previous two years. At the beginning of January, the same 200-day average already acted as a resistance. The deeper correction pattern suggests a pullback to 1470, a 38.2% Fibonacci retracement.
Fundamentally, the big stimulus for households should accelerate inflation and support interest for Gold. This trade was the focus of the markets after the Global Financial Crisis, but it subsequently emerged that stimulus and QE did not accelerate inflation, causing a bearish trend in Gold from 2011 to 2015.
So far we believe that this time the stimulus is a serious pro-inflationary factor as households are not as debt-burdened as they were in 2008/09 and government support measures are focused on direct payments to households and the unemployed rather than bailing out companies.
The FxPro Analyst Team