Investor interest in precious metals is shining with renewed vigour as some investors see them as a safe haven amid the storm of the crypto market. Having broken above $1700, gold is showing the first signs of breaking the downtrend that has been in place since March this year.

Intraday on Tuesday, gold was up 3%, spurred by rising volatility in cryptocurrencies and overall positive dynamics in traditional financial markets.
But to be precise, gold showed an impressive jump as early as Friday, as the bulls managed to push the price out once again of the area of the lows of the last six weeks, and further, a whirlwind of events picked up and lifted it higher.
The powerful rally in gold on Friday and Tuesday stands out, for there was no rally in the stock indices on that day, and the collapse in the dollar only happened on Friday. This could be the first signal that we are seeing the beginning of a rebound in gold, and investors, who have been cautious in putting large amounts of capital into gold since late September, are now taking an active bullish stance.
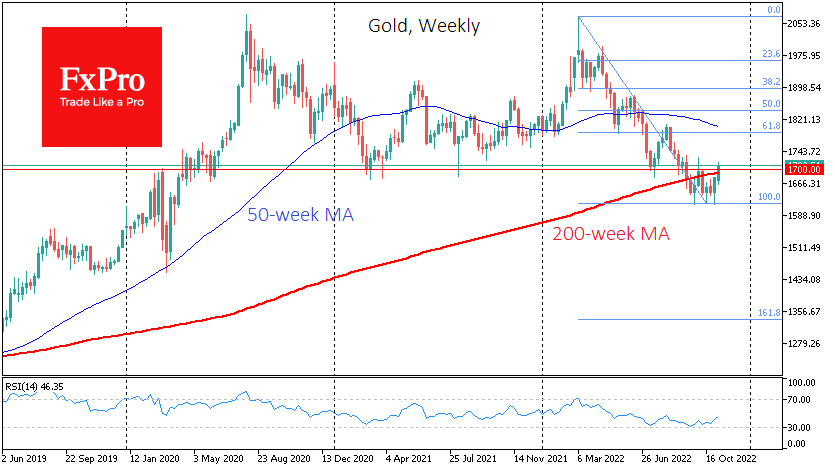
Among the fundamental factors supporting the rise in the gold price is the increased buying of gold by central banks, which last quarter bought the maximum amount of gold since the 1980s. It is tactically difficult to persuade central bankers to buy bonds when prices are falling, and central banks of developed countries one by one say they are not finished with a rate hike, suggesting further pressure on bond prices. Meanwhile, overall risk appetite has risen in anticipation of a minor step up of hikes later, drawing attention to the cheaper gold.
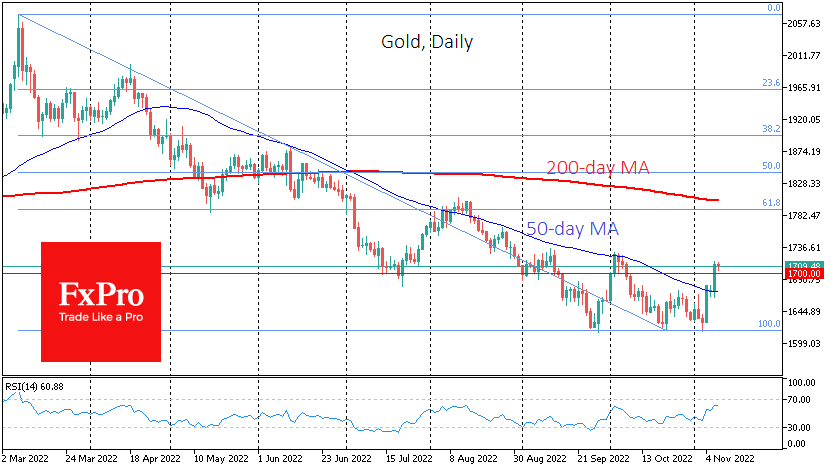
This week, the price broke through its 50-day moving average at the end of the previous week, and on Monday and Tuesday, this line was already in active support. In addition, gold immediately managed to move above the former support line of July and September. To be sure of breaking the trend, one should wait until the price crosses above the area of the previous highs near $1725. If that happens, the price might end the correction rather quickly and go to $1790-1800, which includes the 61.8% Fibonacci retracement levels of the declines since March, the local highs of August, and the 200-day MA.
The FxPro Analyst Team