Categories: Market Overview

Gold: volatility at the top

Gold’s 5% rally in the first 30 hours of the trading week, and touching the important round level of $3500, was followed by a steep fall to $3260 in the next 30 hours. After that, the price stabilised at $3340, close to the highs of the previous week.

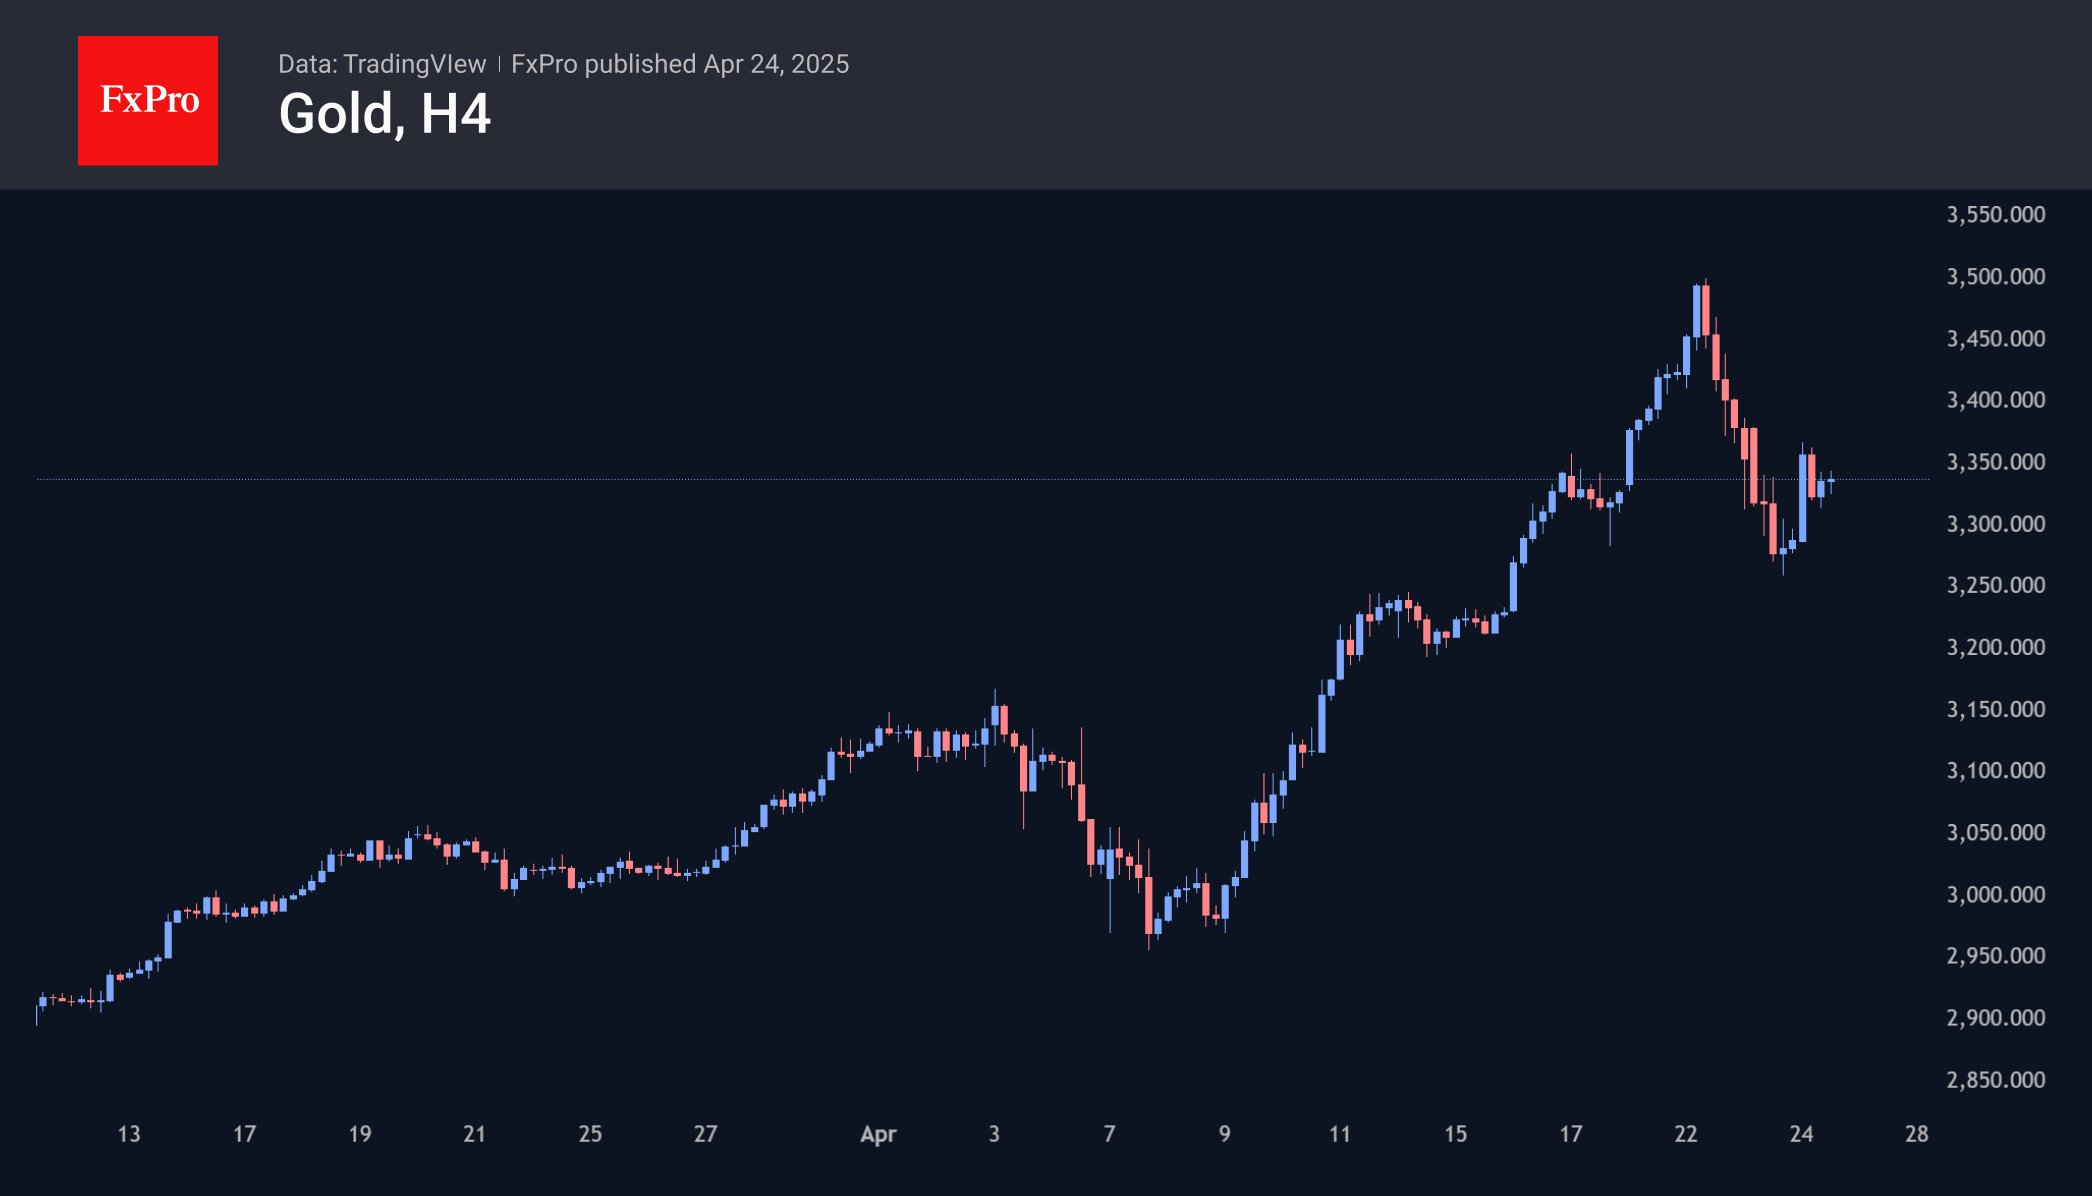
Signs of a ‘head and shoulders’ pattern are forming on the charts. In case of a new decline under $3300, we may witness the acceleration of profit-taking. It may be a selloff after a dizzying rally, with the potential to go below $3000, mirroring early April’s growth. The long-term technical picture points to continued overheating and elevated correction potential.

An alternative medium-term scenario is that the massive decline has already cleared the way for a new wave of gains. The news on tariffs and geopolitical tensions has enough power to override the entire technical picture.

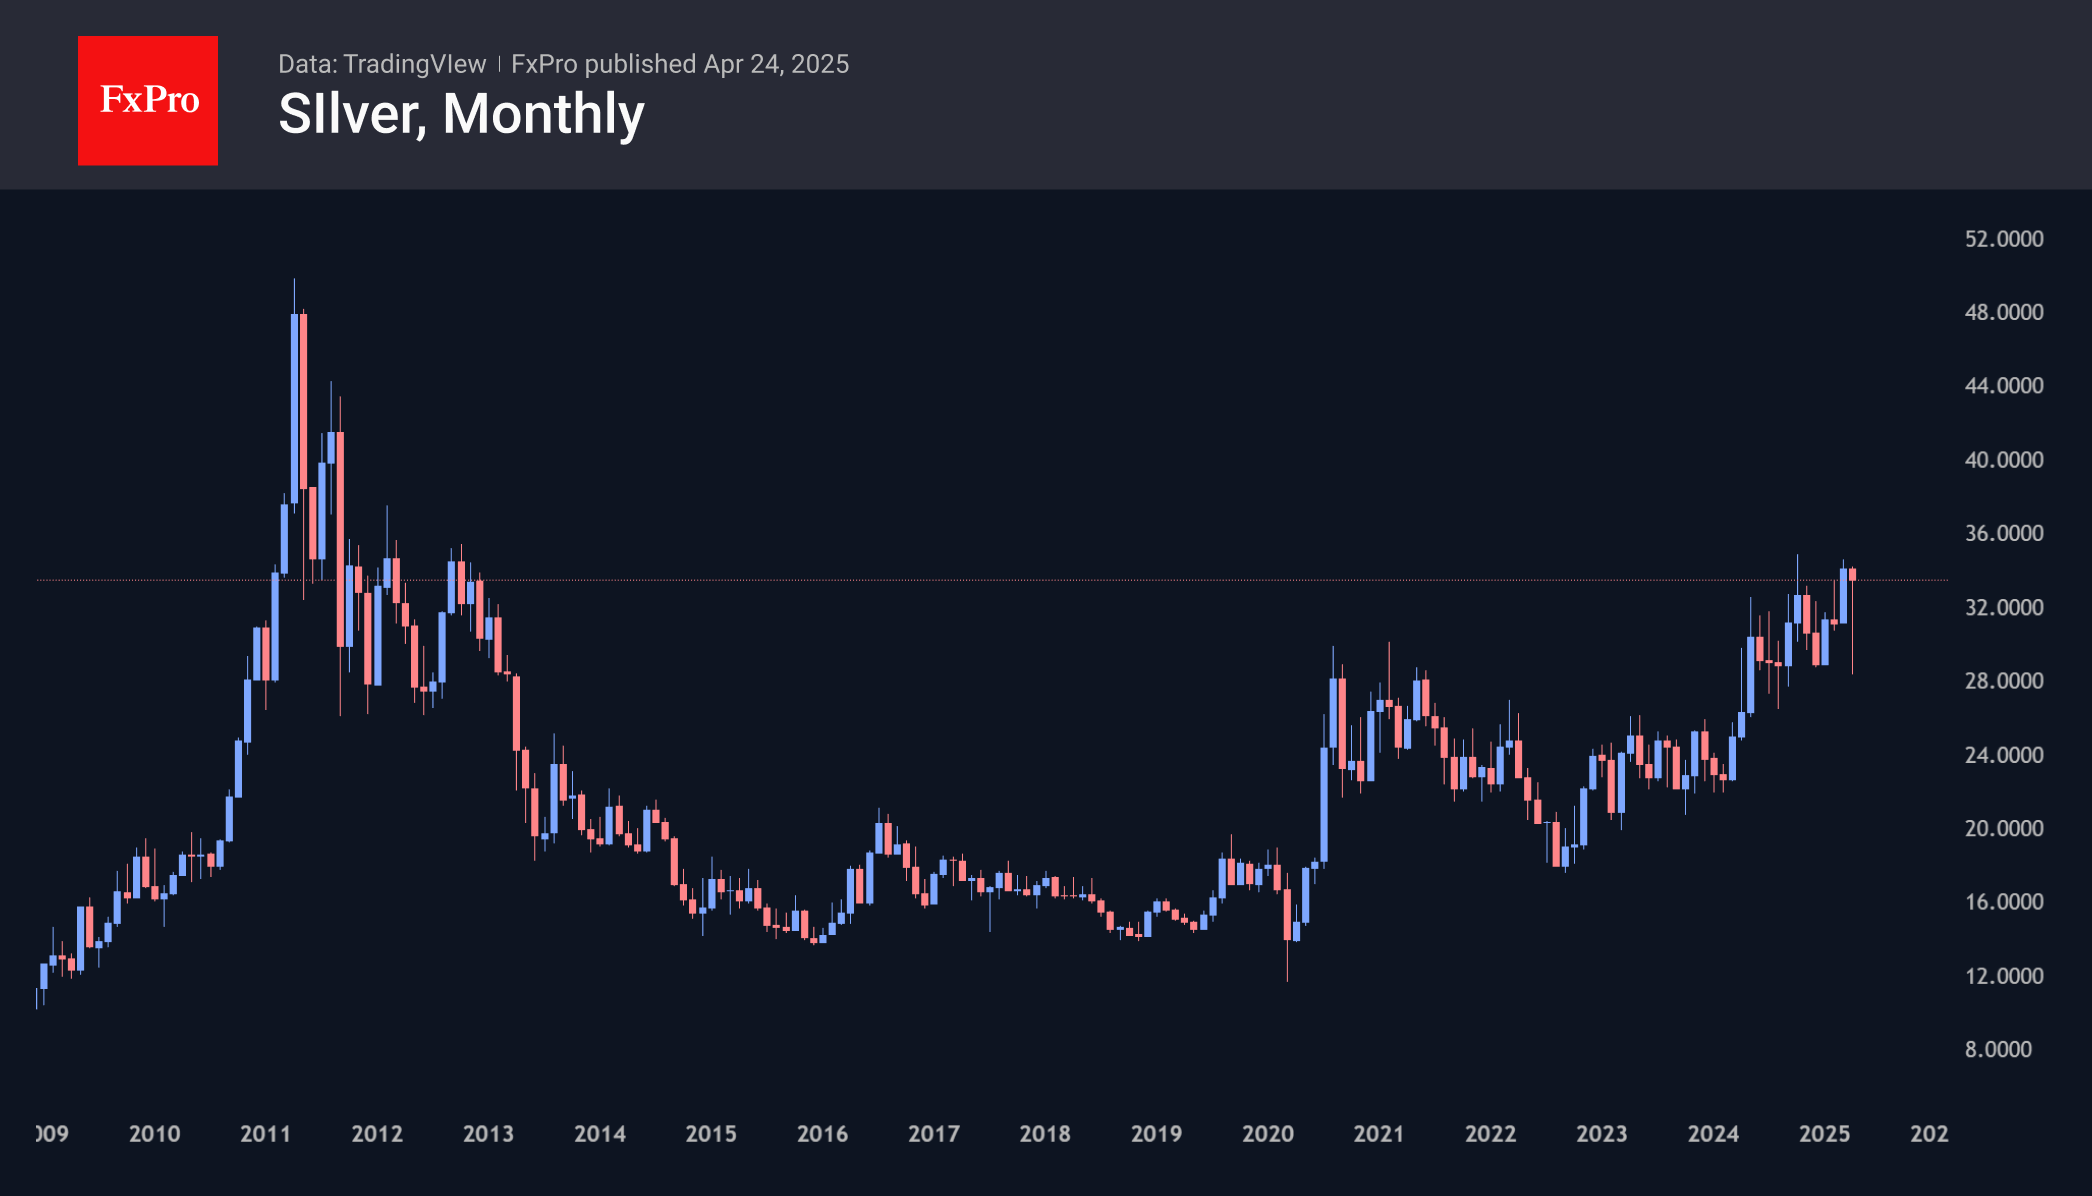
Silver is moving asynchronously to gold. It has almost managed to climb out of the hole it fell into in early April. This return to the highs of October 2024 and March 2025 is of great significance. From around this area near $34, we also saw a reversal in 2012, after which the price lost 60% in the following three years.

The FxPro Analyst Team

The FxPro Analyst Team

Our team consists of financial market experts. Our dedicated professionals prepare reviews on the foreign exchange market situation, Crude Oil, Gold and Stock Indices. All the analysts are regularly published in the world leading economic media.

Share
Published by
The FxPro Analyst Team
Tags: goldSilver

Recent Posts

Forex has set its priorities

In 2026, experts favour the yen, see modest euro growth, and expect pressure on the…

2 hours ago

Bear market rebound in crypto is likely to continue

Crypto rebounds continue; Bitcoin faces resistance, with a mixed market outlook ahead, as regulatory changes…

3 hours ago

Coca-Cola Wave Analysis – 4 December 2025

Coca-Cola: ⬇️ Sell - Coca-Cola reversed from long-term resistance level 73.25 - Likely to fall to…

16 hours ago

DraftKings Wave Analysis – 4 December 2025

DraftKings: ⬆️ Buy - DraftKings reversed from support zone - Likely to rise to resistance level…

16 hours ago

NVDA Wave Analysis – 4 December 2025

NVDA: ⬆️ Buy - NVDA reversed from support zone - Likely to rise to resistance level…

18 hours ago

Basic Attention Token Wave Analysis – 4 December 2025

Basic Attention Token: ⬇️ Sell - Basic Attention Token reversed from resistance level 0.2800 - Likely…

18 hours ago

This website uses cookies