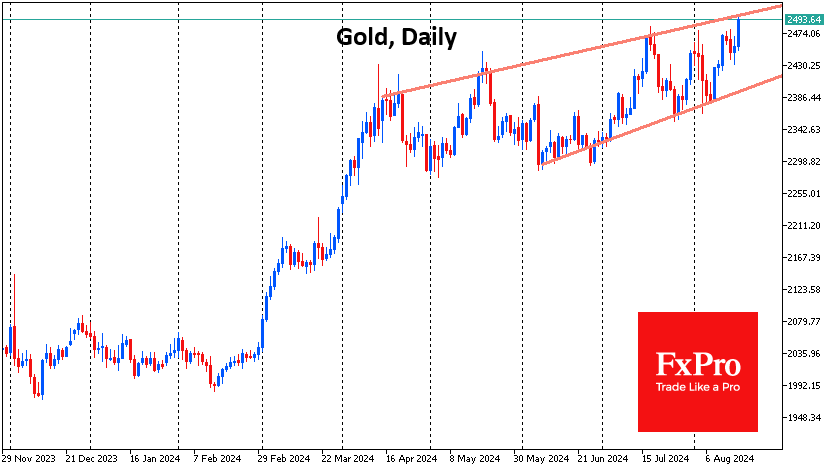
Gold has been rising steadily since the end of last week and is attempting to consolidate above $2470 per troy ounce on the spot market for the third time in the last 30 days. Gold has moved in tandem with equities this month, but it is worth noting that it fell less aggressively during the panic and outpaced the rally.

So, gold is riding on a global recovery in demand for risk assets, but it has the fundamental support in its arsenal that has pushed the price to repeated all-time highs since March.
A trend line can be drawn across the local lows of May from which gold rallied in the early days of August. Combined with local resistance at $2475, this forms a bullish triangle with a high probability of a breakout.
The next upside target is $2500. This is the psychologically important round level and the resistance line of the uptrend drawn by the April, May and July highs.
As far as more distant growth targets are concerned, the $2800-2900 area is worth mentioning. The upper boundary of this range is the 261.8% Fibonacci level of growth from the September-October 2022 lows to the April 2023 highs.
The lower boundary of the range is formed by the 161.8% level of the growth impulse from the October lows to the April-May highs. This rally began with the first signs of a shift in the Fed’s monetary policy, supported by tensions in the Middle East and the desire of some central banks to diversify their reserves away from the dollar.
The FxPro Analyst Team