In just ten days, gold has risen by 11% or around $200. At the start of the day on Monday, the price was approaching $2010. Historically, this is thin-air territory for gold. Despite the threat of a short-term pullback to replenish the bulls’ positions, the medium- and long-term trends are up, opening the potential for gains to the $2200 area as a medium-term benchmark and $2500 as a long-term benchmark.

The problems in the US and Swiss banking sectors have triggered a frenzy of demand for gold and cryptocurrencies. The risk of default on large deposits has increased, although so far, it has mainly been the holders of stocks and bonds of troubled banks who have suffered losses rather than depositors.
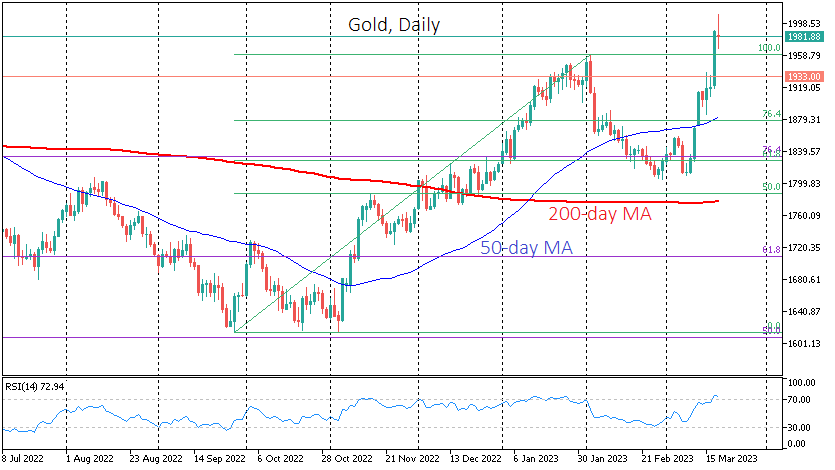
In the weekly timeframe, the RSI is approaching the overbought level of over 70, where corrections have regularly started since the beginning of the year, as the bulls prefer to “blow off steam”. The RSI is already overbought on the daily timeframe, suggesting that price action will need to be watched closely. A move back out of overbought territory would be one of the first signals of the start of a local correction.
Taking a step back, the spark of demand for gold ignited a huge surge. Gold was corrected during February, falling from $1960 to below $1810. This was an almost unquestioned Fibonacci retracement to the 61.8% level of last year’s November-January momentum. Another bullish signal is that gold broke the previous high at $1960 in a sharp move on Friday, which can now be considered support.
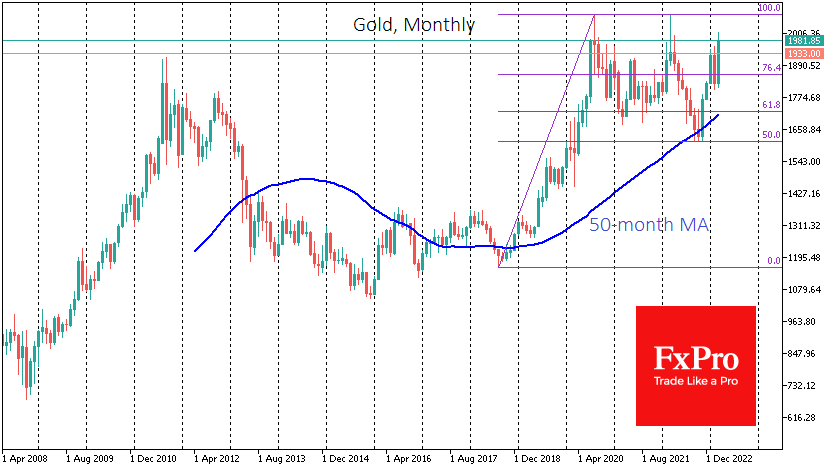
The long-term picture is also bullish. There have been two phases in gold since 2018: a two-year rally since August 2018 and a nearly flat two-year sideways rally. Last year, gold frayed our nerves, breaking out of the $1700-2000 sideways range and temporarily below the 50-month average, giving back 50% of its initial rally but rebounding strongly from $1616 in November last year.
Globally, we believe that in 2018 we have seen the start of a new multi-year market cycle. The initial growth momentum of 2018-2020, has been replaced by a prolonged sideways cycle in 2020-2022. This seems to have come to an end and now gold awaits a new high. A potential target for the new momentum looks to be the area of $2500-2600, where the 161.8% level of the initial momentum is located.
The FxPro Analyst Team