Categories: Market Overview

Gold Struggles After Reaching New Highs

Gold started the week with a decisive renewal of all-time highs, reaching the maximum spot price of $2531 per troy ounce. However, the bulls failed to seize the initiative finally, and on Thursday, gold lost more than 1%, falling back to the depths of the upward trend established in April.

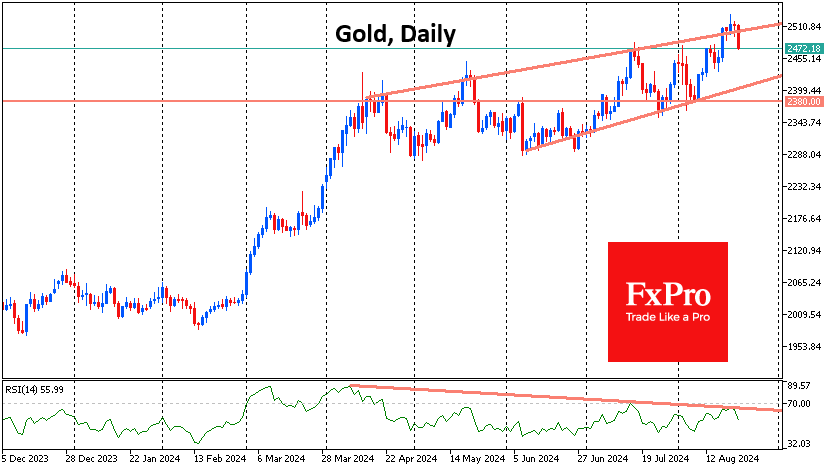
We also pay attention to the exhaustion of the growth momentum. On daily timeframes, a divergence is forming between a sequence of increasingly higher price highs and increasingly lower RSI highs. This is considered a harbinger of a deeper dive, and significantly, the most recent reversal occurred from levels below the overbought area. Thus, it is worth paying attention to how events will unfold next.

Trading within the above trend opens the door for a relatively quick pullback to $2420. It will be possible to speak about the break of the upward trend only when the price falls below $2380 – the previous local lows. 

The FxPro Analyst Team

The FxPro Analyst Team

Our team consists of financial market experts. Our dedicated professionals prepare reviews on the foreign exchange market situation, Crude Oil, Gold and Stock Indices. All the analysts are regularly published in the world leading economic media.

Share
Published by
The FxPro Analyst Team
Tags: gold

Recent Posts

Nikkei 225 index Wave Analysis 20 September 2024

- Nikkei 225 index rising inside minor impulse waves 3 - Likely to reach resistance…

4 hours ago

NZDJPY Wave Analysis 20 September 2024

- NZDJPY rising inside corrective wave ii - Likely to rise to resistance level 91.65…

4 hours ago

Gold terminates the last sceptics

Gold started the week with new highs and ended the week up 1.3%, despite a…

10 hours ago

The Crypto Market’s Steady Ascent

Crypto market cap rose by 3.2% to $2.21 trillion overnight. This made the struggle to…

16 hours ago

Gold Wave Analysis 19 September 2024

- Gold reversed from support level 2550.00 - Likely to rise to resistance level 2600.00…

1 day ago

S&P 500 Wave Analysis 19 September 2024

- S&P 500 broke key resistance level 5670.00 - Likely to rise to resistance level…

1 day ago

This website uses cookies