Categories: Market Overview

Gold possibly targets new record highs

Gold rose for the third trading session in a row, gaining more than 0.8% since the beginning of the day and reaching five-week highs earlier today at $1969.
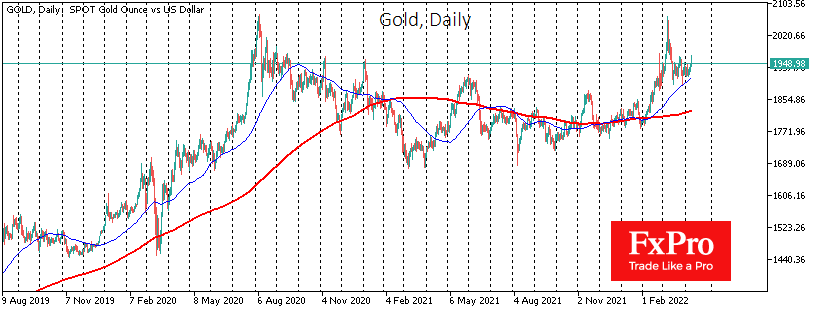
Previously, for almost a month, gold gained strong support on declines below $1920, where the momentum of the metal lost power last May. Strong support on the dips indicates that we are seeing a new chapter in precious metal’s momentum.

The bullish optimism is also supported by the acceleration in silver, which is adding more than 2% on Monday to $25.2.

Also noteworthy is the rebound in stock price performance and trading volumes of the world’s largest gold miners.

Since the beginning of April, the rise may well be the first sign that gold is finally coming out of the bigger correction (from August 2020) and the smaller correction (from the early March 2022 peaks). This hypothesis will be confirmed by a renewal of historical highs and a move above $2070. However, the signs now suggest that a move in this direction has already begun and could be completed in a matter of weeks.

The FxPro Analyst Team

The FxPro Analyst Team

Our team consists of financial market experts. Our dedicated professionals prepare reviews on the foreign exchange market situation, Crude Oil, Gold and Stock Indices. All the analysts are regularly published in the world leading economic media.

Share
Published by
The FxPro Analyst Team
Tags: gold

Recent Posts

GBPUSD Wave Analysis 14 November 2024

- GBPUSD reversed from strong support level 1.2665 - Likely to rise to resistance level…

4 hours ago

USDCAD Wave Analysis 14 November 2024

- USDCAD broke resistance level 1.3950 - Likely to rise to resistance level 1.4050 USDCAD…

4 hours ago

The dollar has reached range limits

The US dollar has strengthened, reaching the upper boundary of its trading range. The British…

7 hours ago

Crypto: Tug-of-war at new altitude

Cryptocurrencies continued to surge, pushing the total cap to $3 trillion. Bitcoin has gained nearly…

7 hours ago

USDJPY Wave Analysis 13 November 2024

- USDJPY broke key resistance level 154.70 - Likely to rise to resistance level 157.20…

1 day ago

USDJPY Wave Analysis 13 November 2024

- USDJPY broke key resistance level 154.70 - Likely to rise to resistance level 157.20…

1 day ago

This website uses cookies