Gold made a strong run on Thursday and Friday, adding a 2.8% during these days combined. This jump pushed gold to the important downward trend resistance line, which has been in force since August 2020.

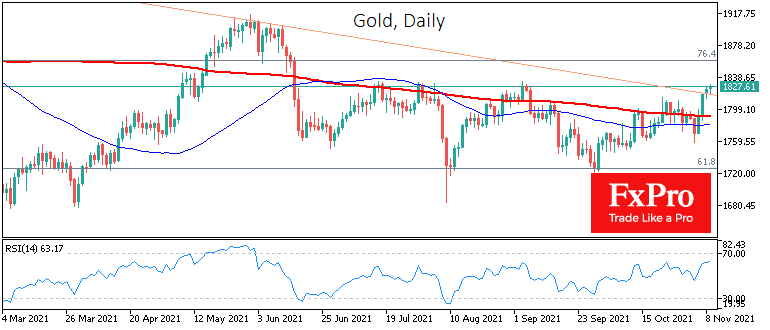
It is still premature to talk about a break of the downtrend, despite several positive signs. Amongst the bullish signals is the retention of quotes above important moving average lines these days. Supported by a relatively strong rise in quotations, overcoming these levels often indicates a break in the trend.
Confirmation of the downward trend break can be triggered by the consolidation (preferably by the week’s results) above $1830. The price has been losing the growth momentum there repeatedly since July.
The developing rebound in gold stocks, which have been gaining for the last three weeks in a row on impressive volumes, should also be seen as positive.
Amongst the risk factors, equity markets have been rising in recent days on the back of falling long-term bond yields, as developed country central banks have assured markets that they will not raise rates any time soon. Overall, however, this could be nothing more than an attempt to stem a wave of selling in the debt market and a short-term bump.
The global trend in yields has turned upwards for yields. Therefore, gold has yet to prove that the downtrend is broken. If it does, it opens long-term upside potential for the gold price to the $2600 area.
The FxPro Analyst Team